With autumn and winter bringing below estimated generation, I was hoping spring 2025 would start to break to trend as months become warmer and the sun comes out.
Our Monthly Solar Performance
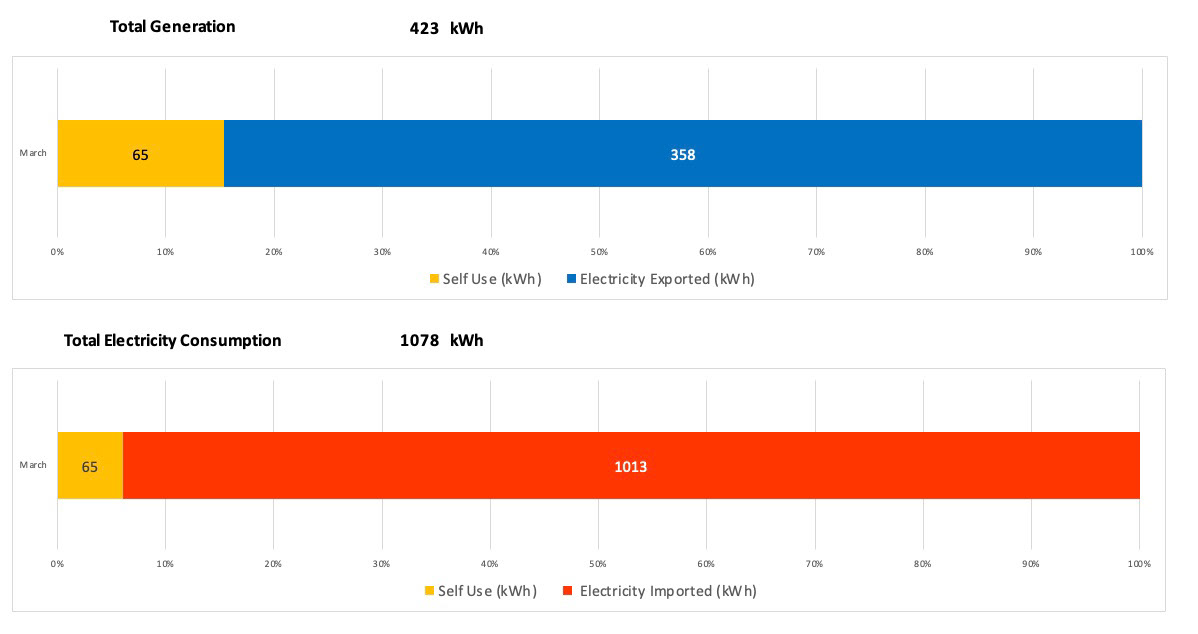
March 2025
Generation in March was record breaking! We generated a huge 423kWh against an estimated generation of 312kWh. This was 36% over the expected generation. In previous years we've never reached the estimated generation. When we compare to previous March generation it was +59% of March 2023's 266kWh and +44% of March 2024's 293kWh.
Our self consumption of solar generated electricity was just 6% with 65kWh self consumed.
Our overall consumption increased to 1078kWh. This was mainly due to 888kWh was consumed by charging two cars.
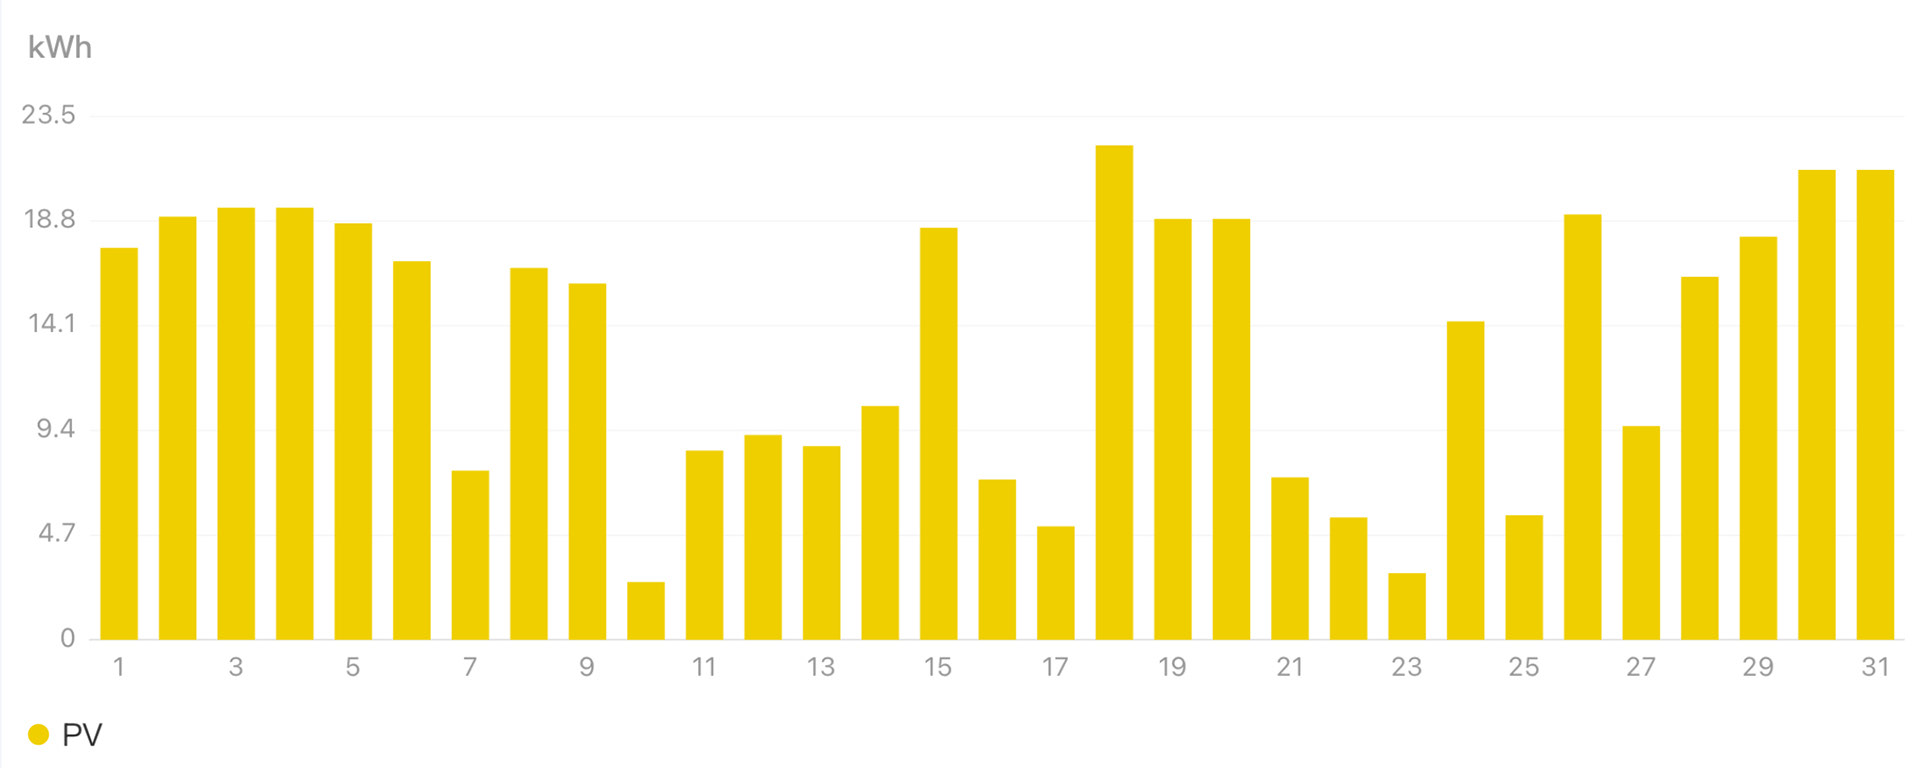
Solar generation started off brilliantly with 8 of the first 9 days of March above 15kWh. There were 17 days over 15kWh compared to just 4 days in 2024. The highest daily generation was 22.2kWh on 18th March.
Solar generation in March 2025
April 2025
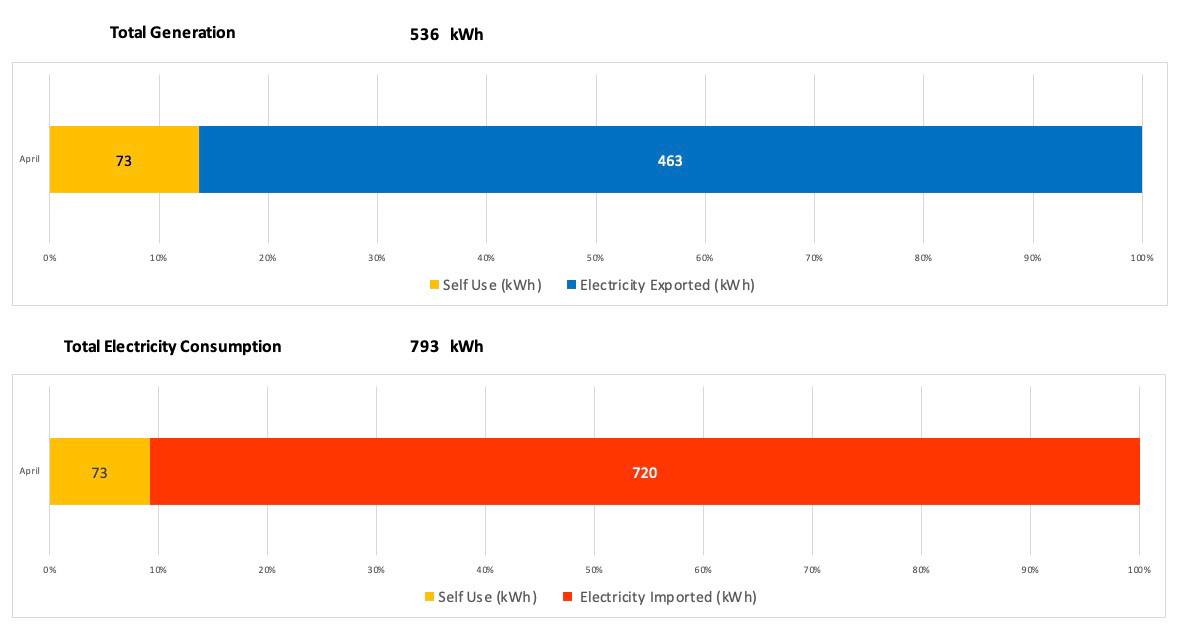
Whilst I thought March was unusual for the time of year April was even better! April saw solar generation of 536kWh, against an estimated generation of 403kWh. That's 33% over the estimated generation. It was not only our highest ever April generation, but our third highest ever generation in a single month. Only June 2023 with 562kWh and June 2024 558kWh have higher generation. Its 49kWh higher than fourth placed 487kWh in May 2023.
Our self consumption of solar was 13%. We exported a huge 463kWh of this generation back to the national grid.
Our overall electricity consumption was 793kWh. 609kWh was consumed by charging two cars.
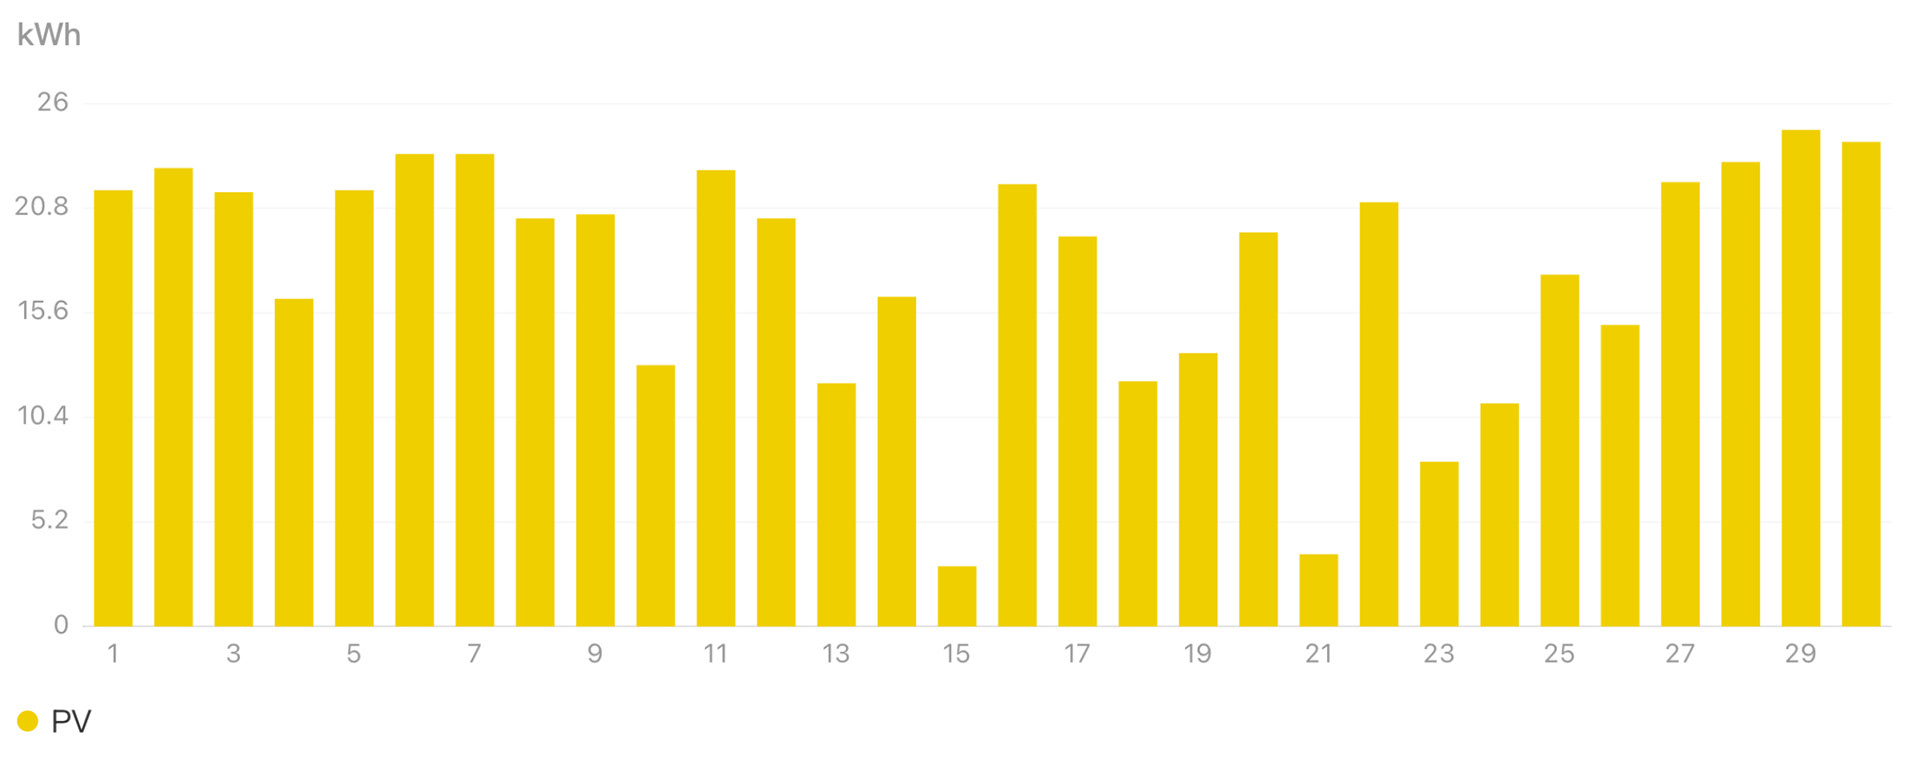
In April there were only 3 days were under 10kWh. We also saw 16 days over 20kWh compared to just 3 days over 20kWh in 2024.
The highest was 24.7kWh on 29th April. This sets the record for the highest ever solar generation for one day in April, beating the previous high of 24.3kWh on 4th April 2023.
There were 12 days higher than April 2024's highest day of 21.7kWh in April 2024.
Solar generation in April 2025
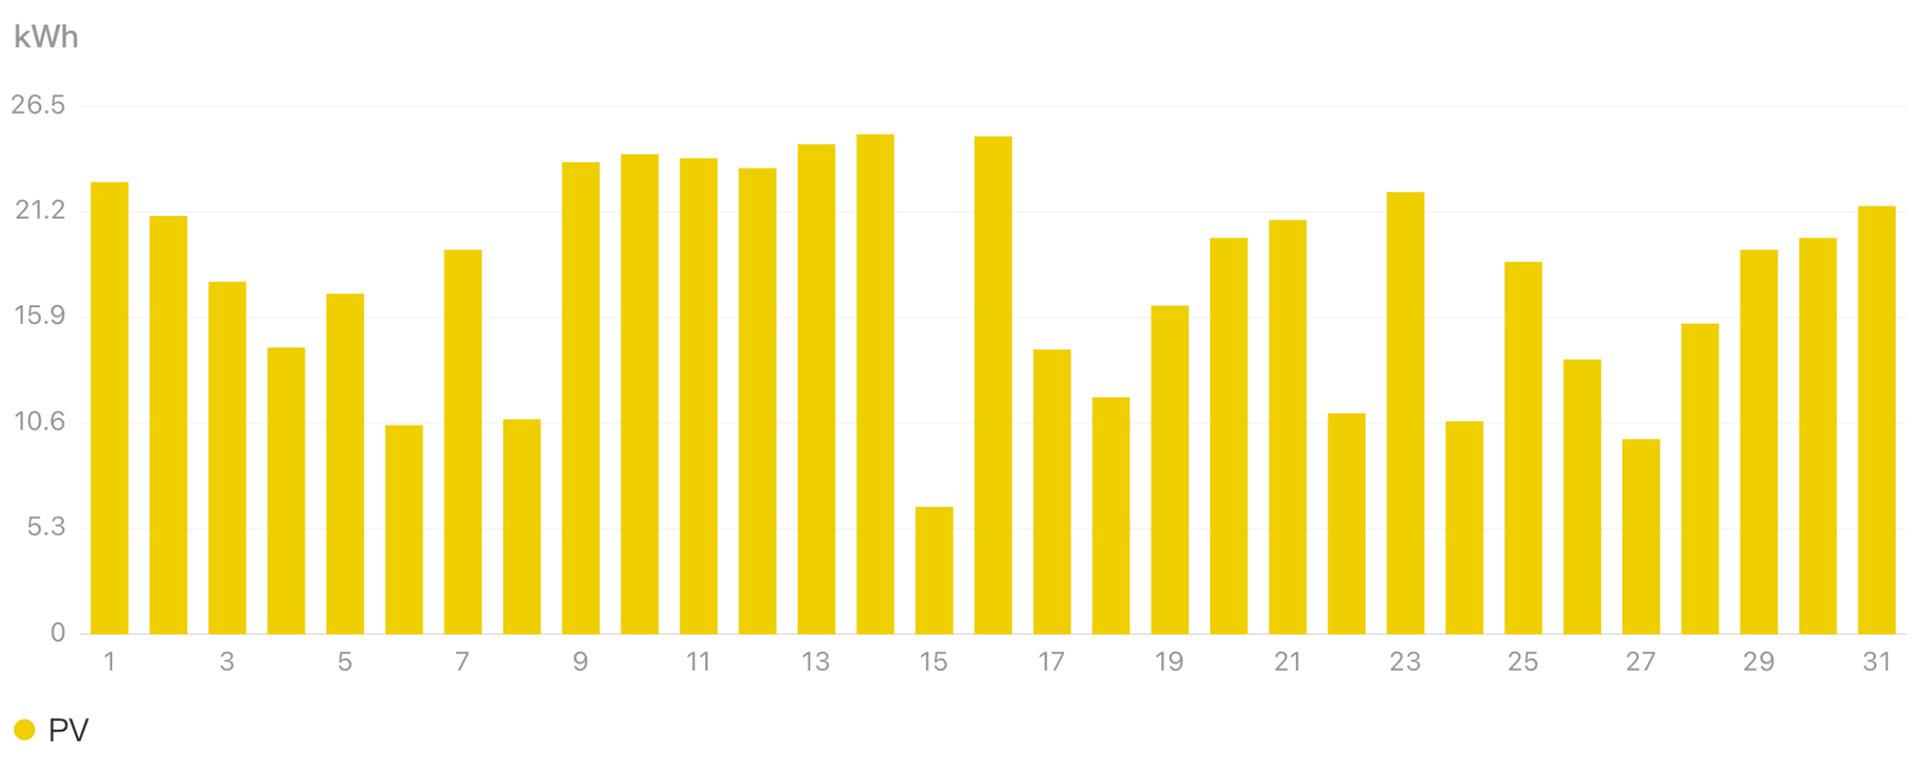
May 2025
May started off very much like how April ended. Daily generation slowly reduced until a fantastic period from 9th to 16th May that saw 176.2kWh generated in just 8 days (average of 22.2kWh per day).
We ended the month with a total generation of 556kWh. That was 25% higher than the estimated 443kWh. It's our highest ever generation in May, beating May 2023's 487kWh.
Our self use consumption of solar was 11%. Thats the highest its been this year.
Our overall electricity consumption was nearly 762.7kWh. 581.3kWh was consumed by charging two cars.
We exported 472.3kWh to the national grid, which was 85% of the solar generated.
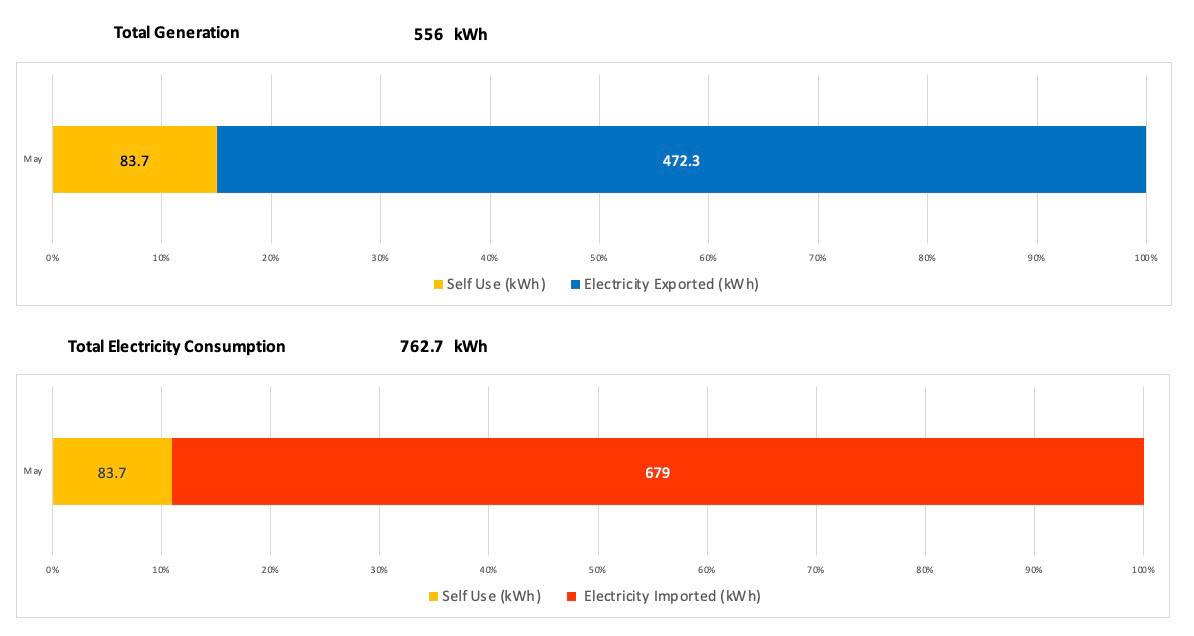
Overall there were 12 days over 20kWh, 9 days under 15kWh and only 1 day under 10kWh.
The highest daily generation was 25.1kWh on 14th May. The lowest was 6.4kWh on 15th May. It just shows how much solar generation can vary from day to day with the months highest and lowest generation occurring in consecutive days.
Solar generation in May 2025
Generation Performance
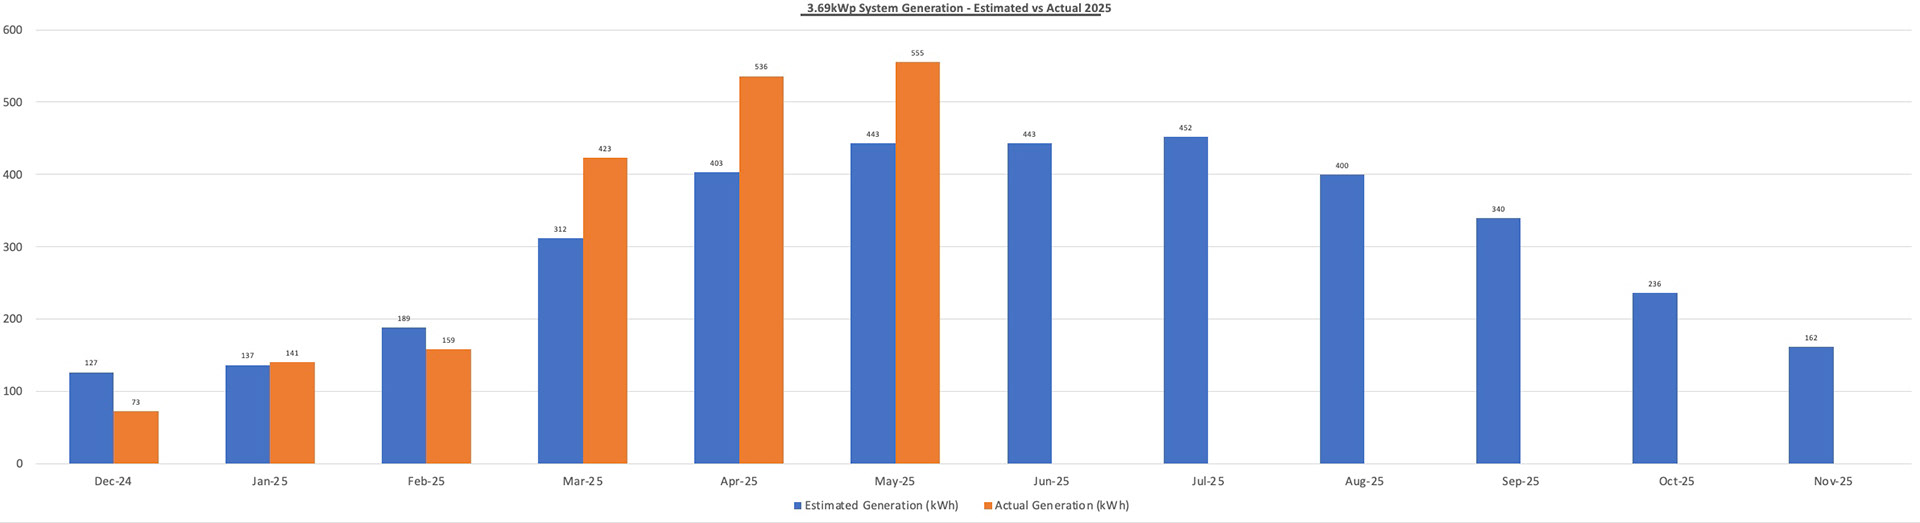
After an under performing Winter, Spring definitely brought out the sunshine! March, April and May were above estimated generation by 36%, 33% and 26% respectively. I can't remember a season where all 3 months over performed by as much as this.
It's not until you see each month against the same months in previous years that you see how outstanding each month actually was.
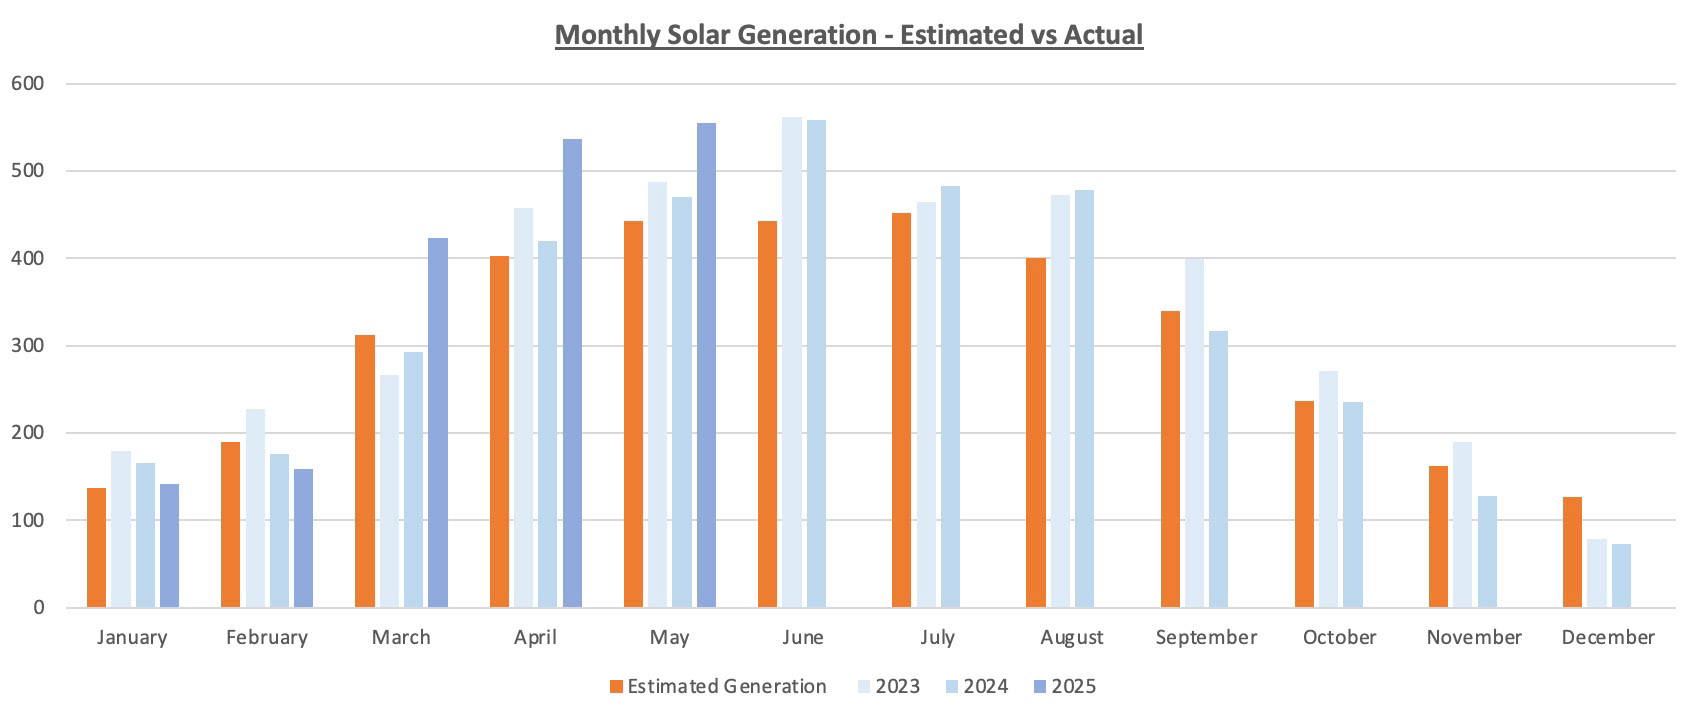
When you look at the total generation during Spring 2025 and compare it to previous spring periods it's set apart from previous years. Spring 2025's generation was on par with generation we've seen during the summer months. Thats just unbelievable!
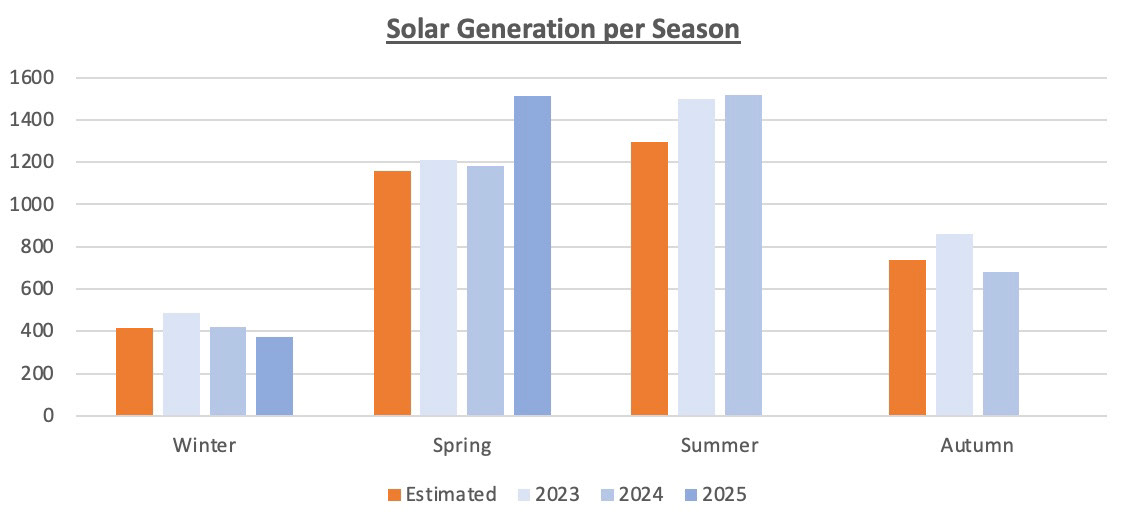
Due to all months over performing we clawed back from being 80kWh under the estimated generation at the end of winter month to being 277kWh ahead by the end of May. That's an overall swing of 357kWh!
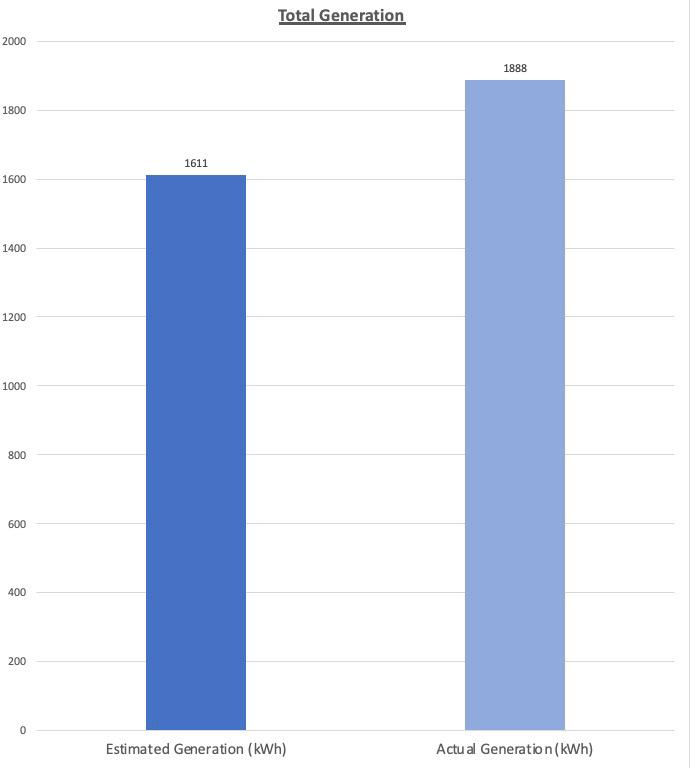
Estimated toActual Generation so far in 2025
Solar data so far in 2025
Savings
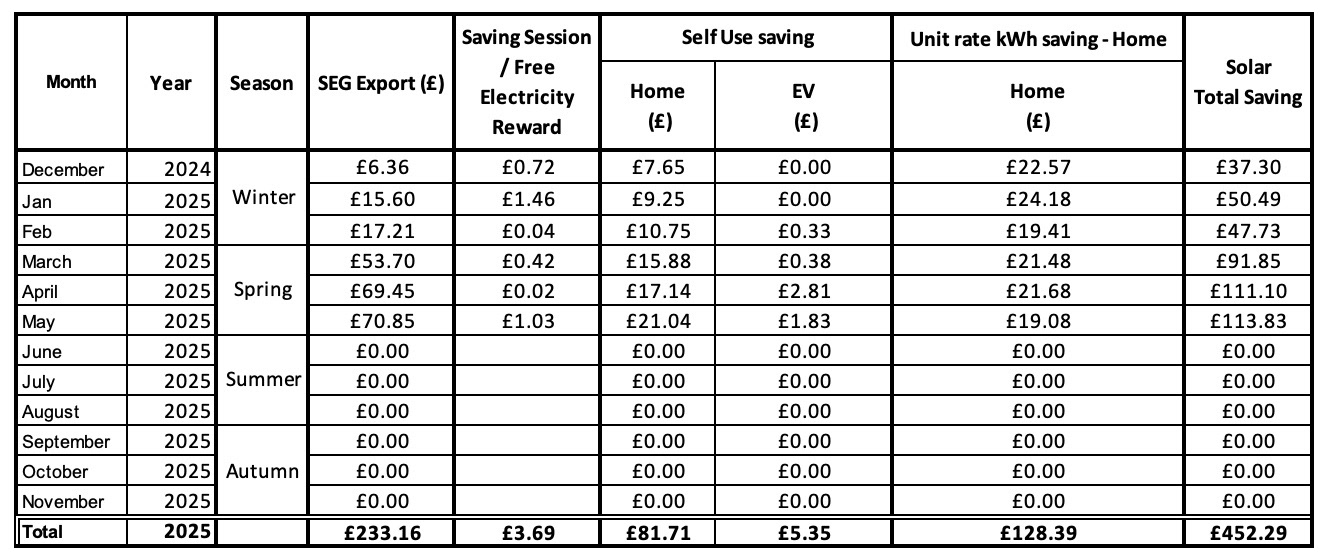
Unlike last year we kind of have less saving avenues. This is because there has been a big reduction in revenue from 'Saving Sessions'. We've stopped exporting during Saving Sessions because they are now paying only 12-13p per kWh compared to £1-2/kWh in 2024. It's not worth the faff to set up each time, or the risk of over exporting our home battery and leaving us with insufficient battery power to get through the remaining evening period. If our home battery runs out we would need to import at 29p/kWh later in the evening so that would negate any saving made from the saving session.
The savings have started to pick up in spring as over performance in spring has seen higher than expected SEG revenue.
Spring brought total savings of £316.78:
* SEG export payments saved £194.00.
* Saving Sessions/Campaign Rewards saved £1.47.
* Self consumption of 217kWh saved £59.08.
* Unit rate kWh savings from importing electricity during the low rate saved £62.24
Savings so far in 2025
So far this year we've saved £452.29, which is £40.04 behind 2024's £492.33 at this point.
Summary
Key Statistics for spring
* 1515kWh generated
* 1293.3kWh exported
* 11% self sufficiency from solar
* £316.78 saved
* Highest generation - 25.1kWh on 14th May
Changes in savings through winter to spring
Savings definitely increased from winter to spring. The longer days of spring and the great weather meant savings increase due to higher solar export (£39.17 in winter compared to £194 in spring).
The longer solar days in spring means there is an increase in savings from solar self use from £27.98 in winter to £59.08 in spring. This decreased the savings from lower unit rate from £66.15 in winter down to £62.24 in spring.
Savings from Saving Sessions/ Octopus Campaign Rewards were only £2.22 in winter and £1.47 in spring.
When we compare savings during winter and spring in 2024 and 2025 we definitely a difference. In 2025 savings in winter were just 30% of the total savings. In 2024 winter accounted for 46% of the total savings during winter and spring.
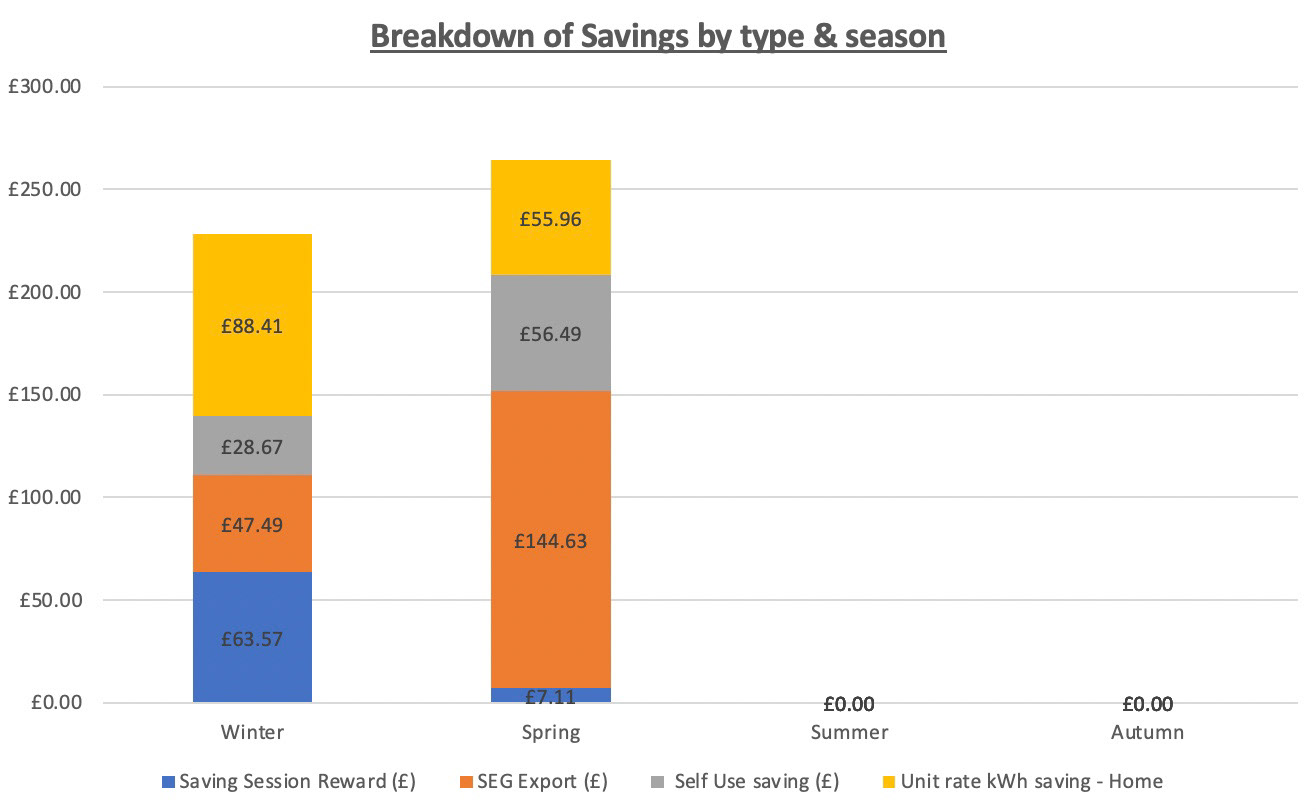
Savings in winter & spring in 2024
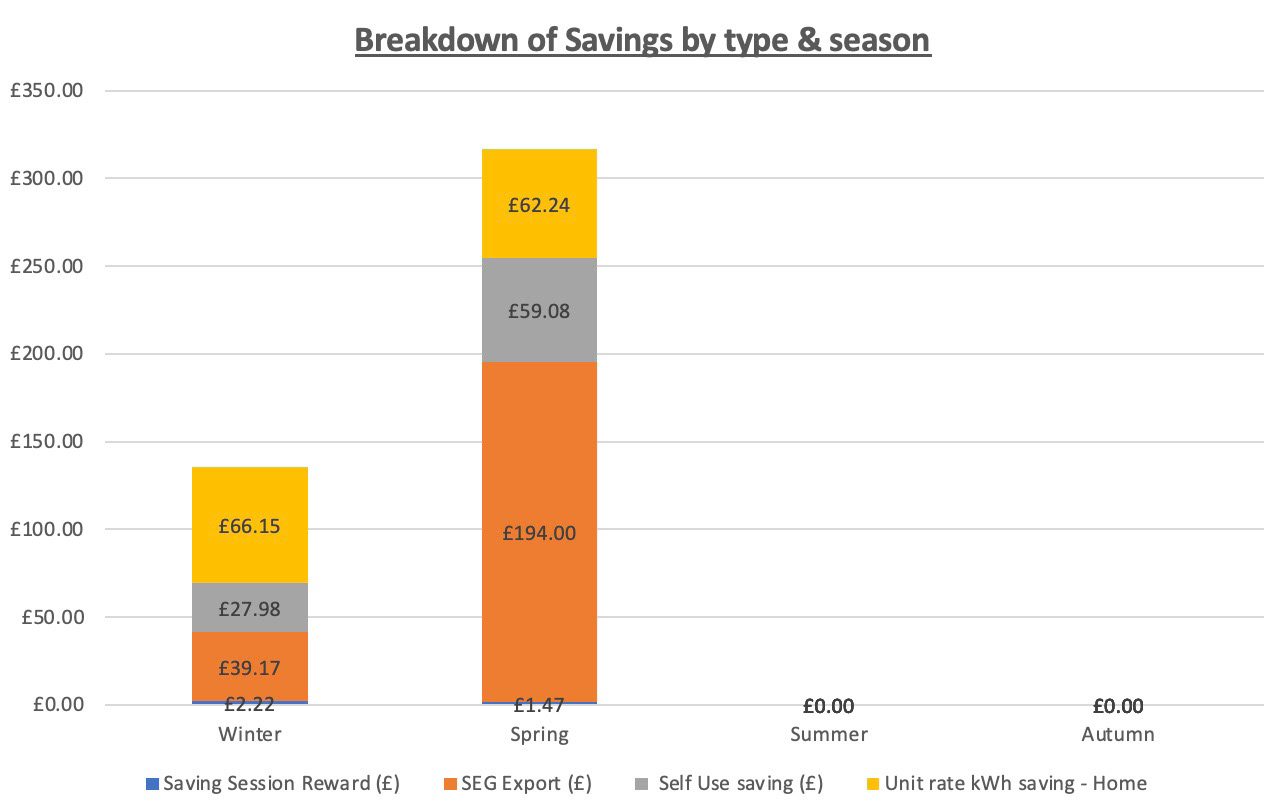
Savings in winter & spring in 2025