October to February was below estimated generation. Considering how good 2025's spring performance was I was hoping 2026 would follow a similar trend.
Our Monthly Solar Performance
March 2026
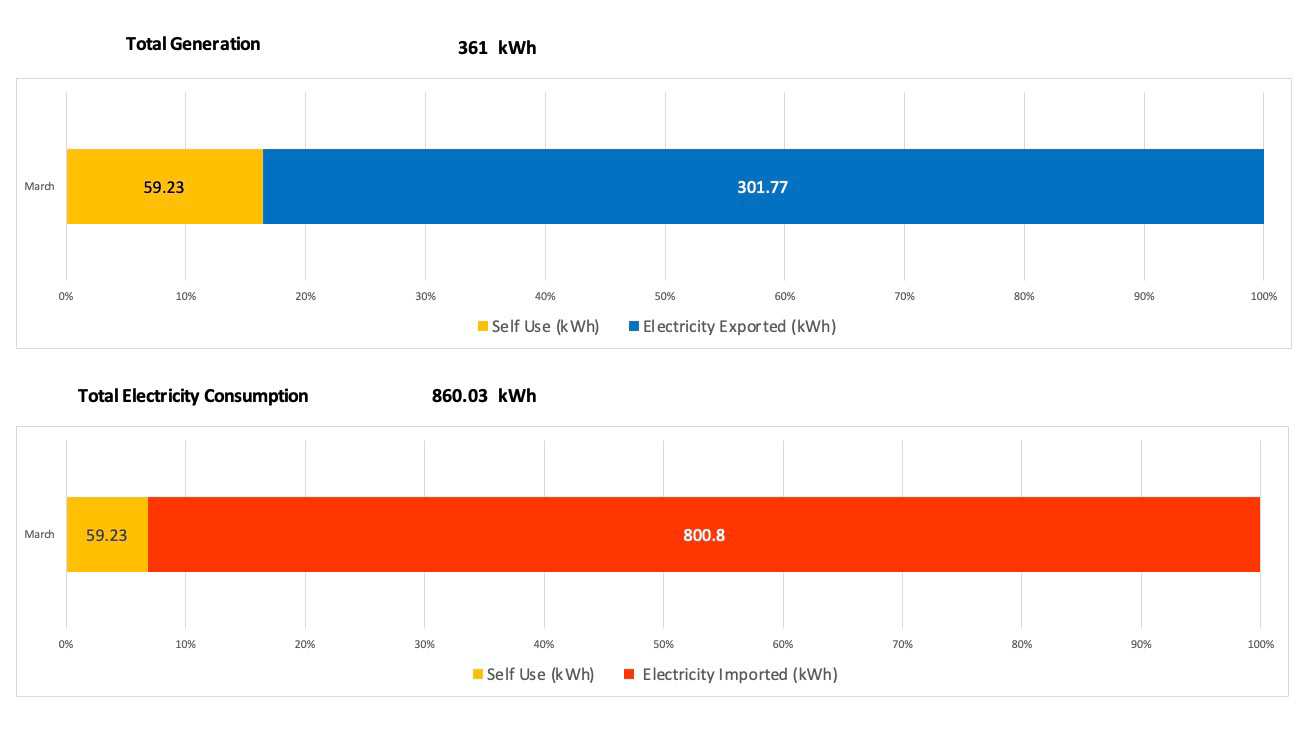
Generation in March wasn't as good as 2025 were we generated a huge 423kW. But we still generated 361kWh against an estimated generation of 312kWh. This was 16% over the expected generation.
Our self consumption of solar generated electricity was just 7% with 59kWh self consumed.
Our overall consumption increased to 860kWh. 627kWh was consumed by charging two cars via the Zappi charger. Due to the battery charge limit on the Volvo EX30 we are finding we need to charge that car off a granny charger (230V plug charger). This means I can't get the charge data via the granny charger.
I'm not a fan of granny chargers at all. We're taking precautions by limiting the charging time to 5 hours with regular inspection of the granny charger and socket just to be sure there aren't any overheating issues.
We had an issue with solar data on the app at the start of March as we charged internet provider. Unfortunately during install of the new fibre cable they damaged our current internet providers cable so we lost internet connection. This means the normal generation chartb was missing generation data so I had to take a screenshot off the actual inverter screen.
Solar generation didn't started off well with only 3 of the first 10 days of March above 15kWh. There were 11 days over 15kWh compared to just 17 days in 2025. There were 20 days over 10kWh and 4 days under 5kWh.
The highest daily generation was 21.8 kWh on 26th March.
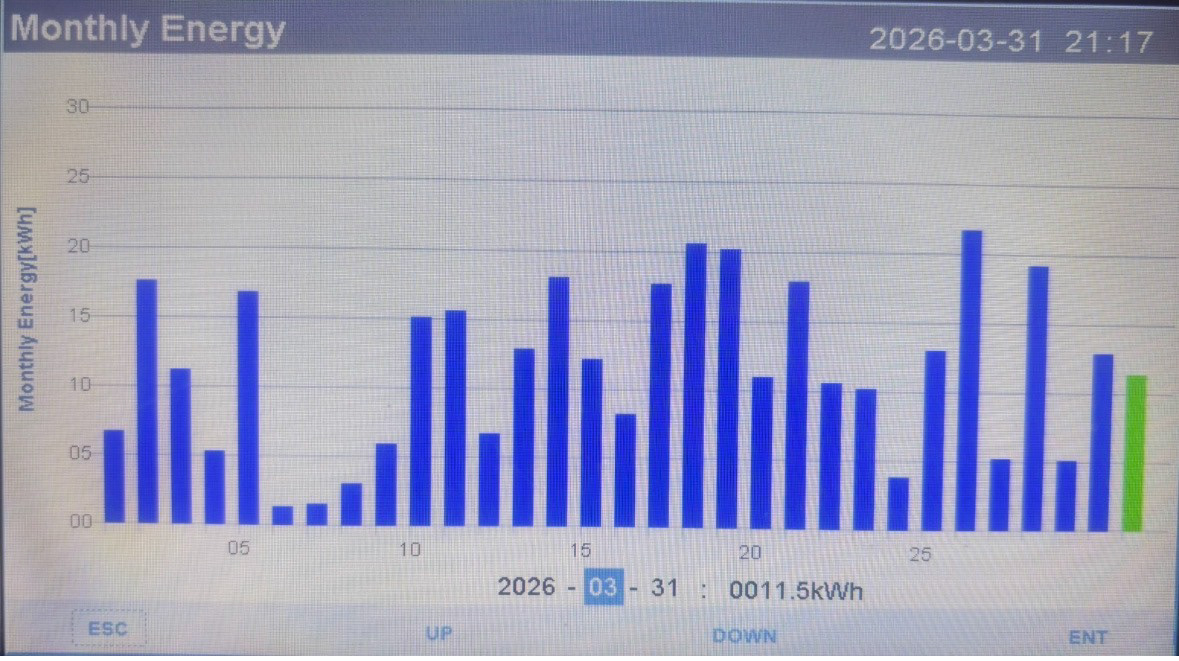
Solar Generation in March 2026
April 2026
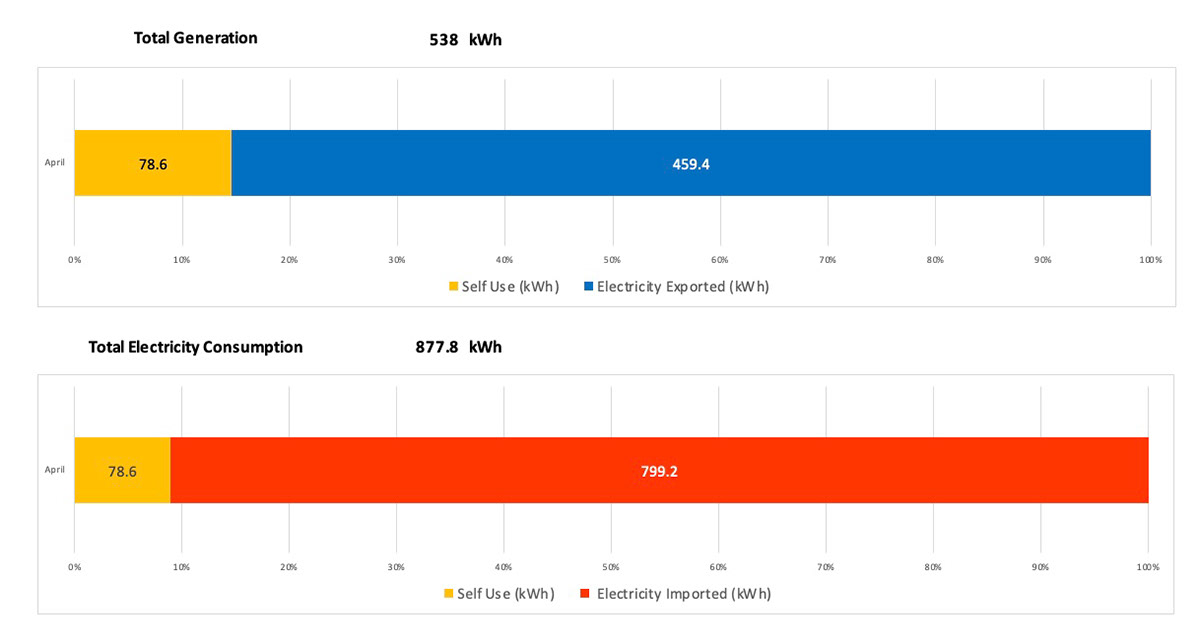
In April 2025 we generated a whooping 536kWh against an estimated generation of 403kWh. I never thought we would beat that but April 2026 was slightly better with 538KWh! That's 34% over the estimated generation. It was not only our highest ever April generation, but our fifth highest ever generation in a single month. Only June 2023 (562kWh), June 2024 (558kWh), May 2025 (556kWh) and June 2025 (554kWh) have higher generation.
Our self consumption of solar was 78kWh (9%). We exported a huge 459kWh of this generation back to the national grid.
Our overall electricity consumption was 877.8kWh. 597kWh was consumed by charging two cars via the Zappi (again the granny charger was used on a few occasions which I don't have data for. .
In April there were only 3 days were under 10kWh. We also saw 11 days over 20kWh.
The highest generation was 25.6kWh on both 29th April 2026 and 30th April 2026. This is the highest ever solar generation for one day in April, beating the previous high of 24.7kWh on 29th April 2025.
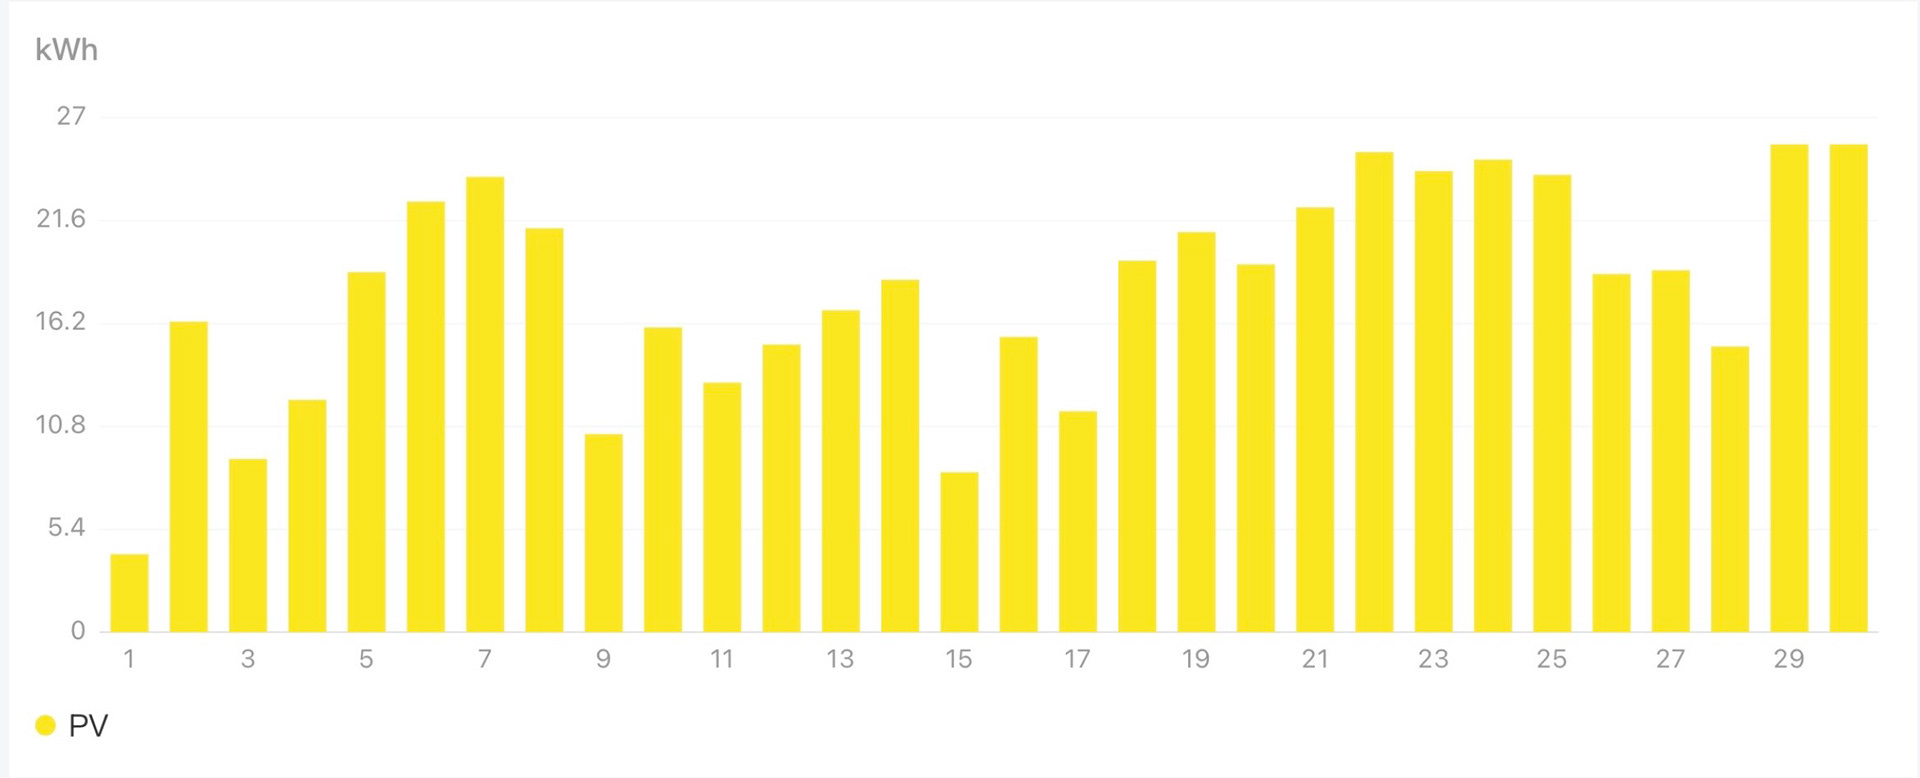
Solar generation in April 2026
May 2025
May started off quite well with an average of 15kWh per day. The month ended with a mini heat wave that saw 213.8kWh generated in just 10 days (average of 21.4kWh per day) between 22nd to 31st May.
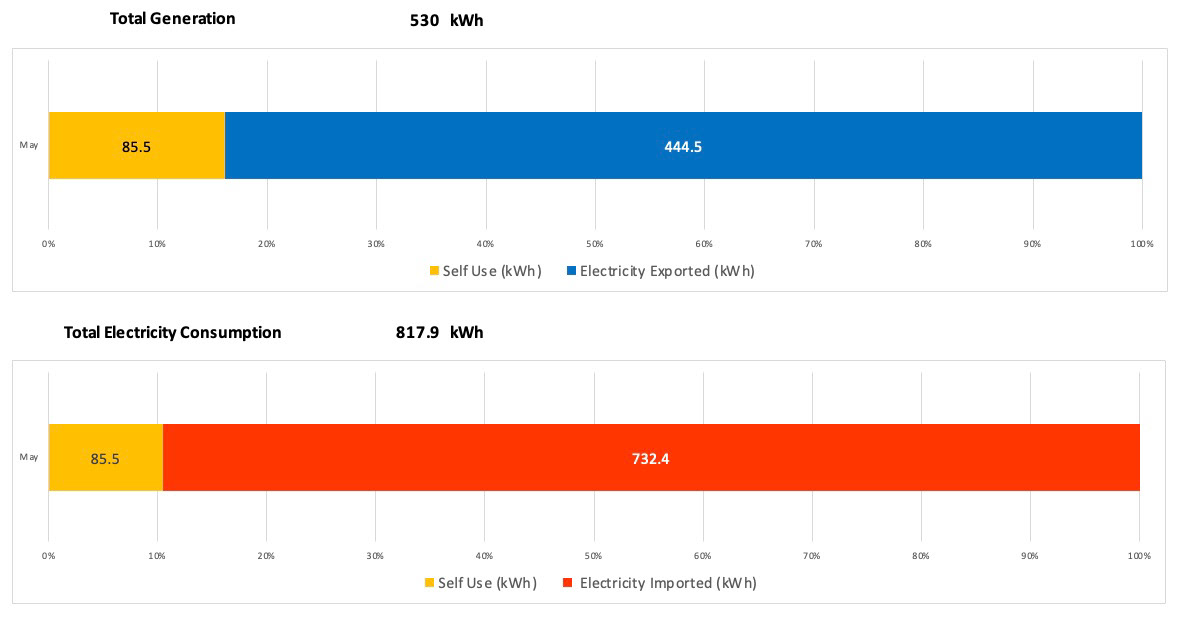
We ended the month with a total generation of 530kWh. That was 20% higher than the estimated 443kWh. It's our second highest ever generation in May, just 26kWh lower than May 2025.
Our self use consumption of solar was 10% (85.5kWh). Thats the highest its been this year.
Our overall electricity consumption was nearly 817.9kWh.
581.3kWh was consumed by charging two cars. 169.8kWh home use and 562.8kWh via the Zappi EV charger.
We exported 444.5kWh to the national grid, which was 84% of the solar generated.
Overall there were 9 days over 20kWh, 10 days under 15kWh and 2 days under 10kWh.
The highest daily generation was 25kWh on 22nd May. The lowest was 5.8kWh on 4th May. It just shows how much solar generation can vary in the same month.
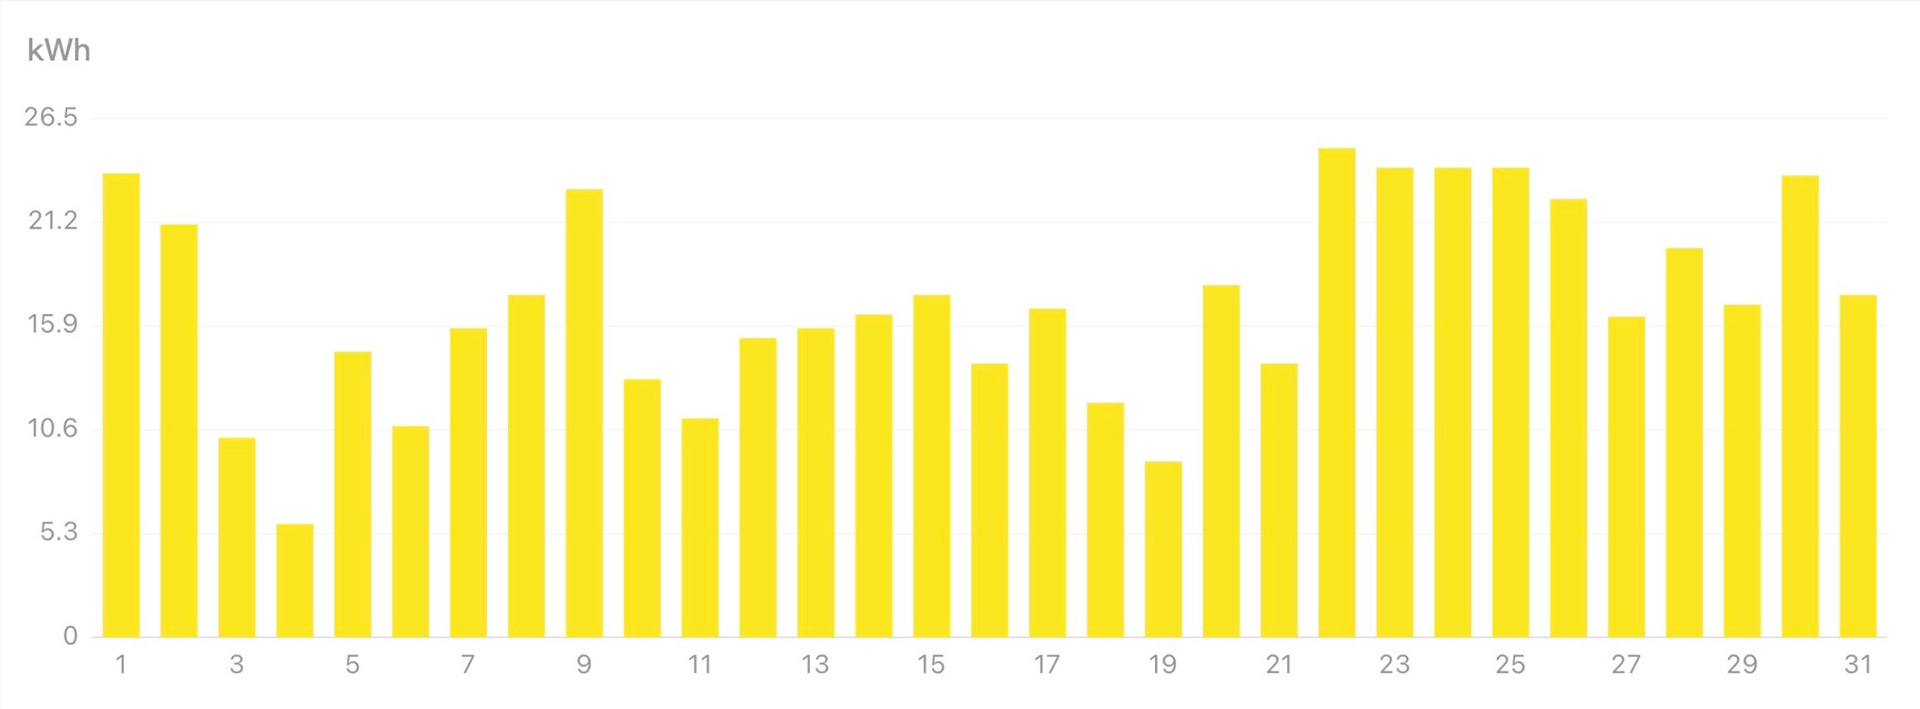
Solar generation in May 2026
Generation Performance - update
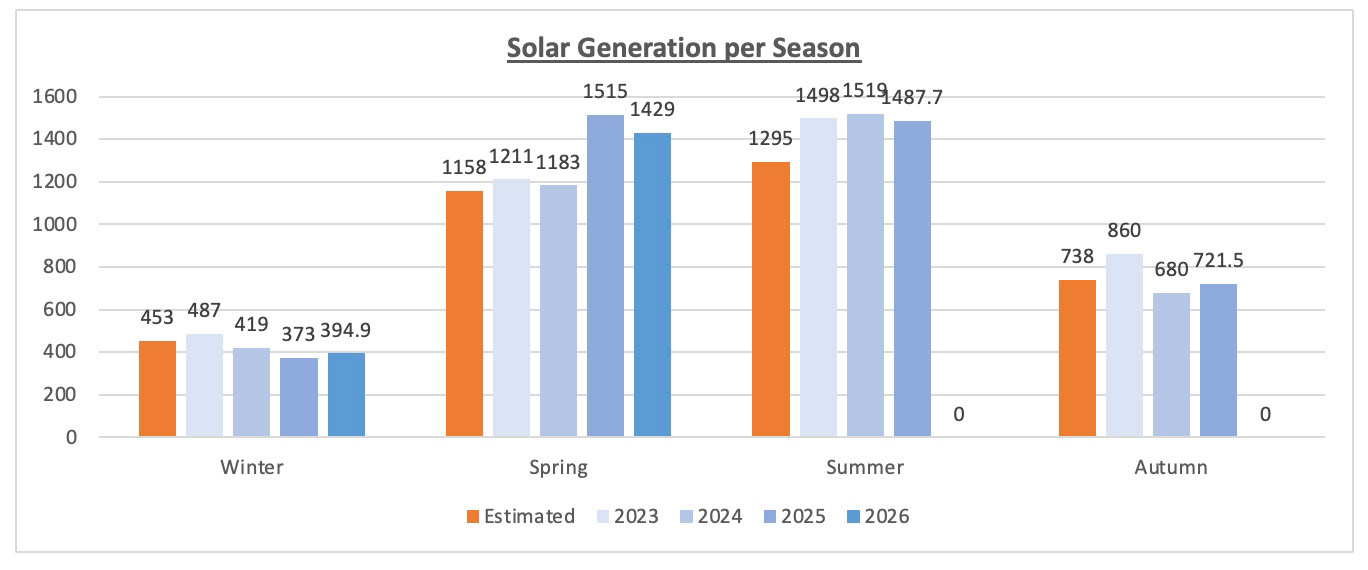
After an under performing Winter, Spring definitely started to bring out the sunshine! March, April and May were above estimated generation by 16%, 33% and 20% respectively.
It's not until you see each month against the same months in previous years that you see how generation changes per year.
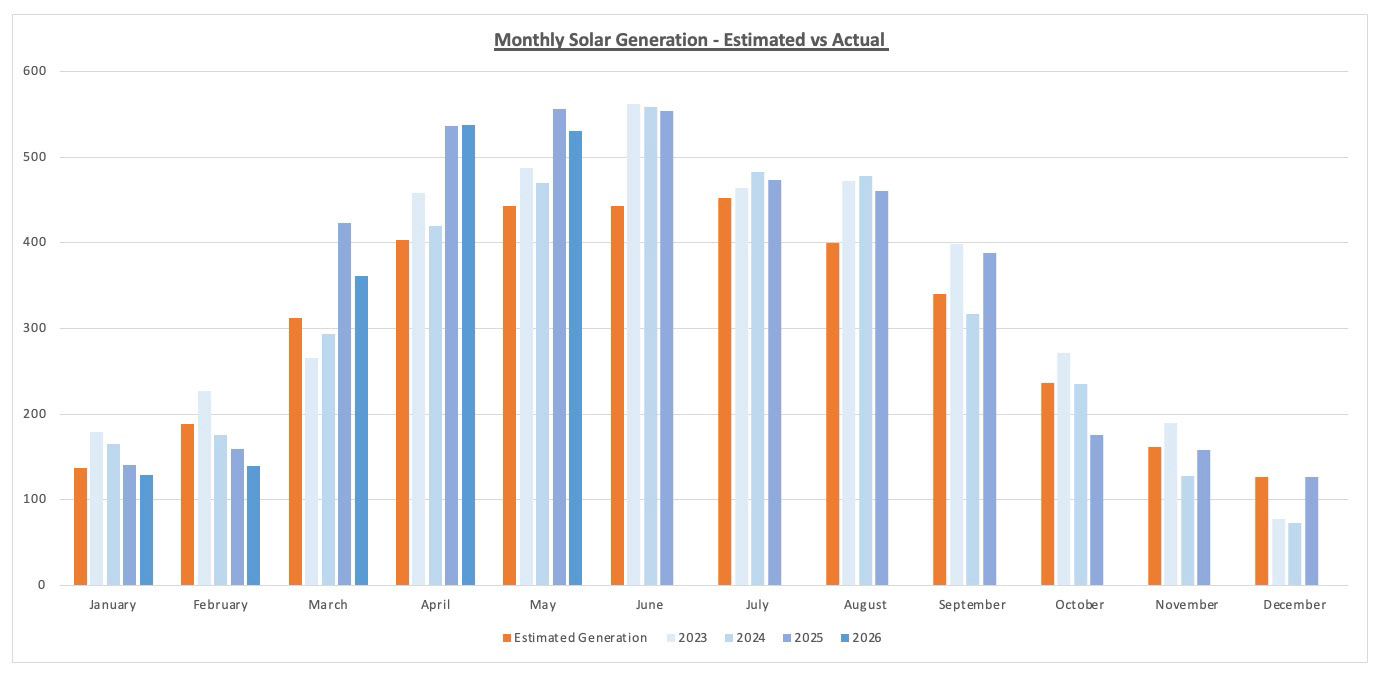
When you look at the total generation during Spring 2026 and compare it to previous spring periods it was our second best Spring season overall (I don't think we will ever beat Spring 2025 as it was such an anomaly. That spring had higher generation than the summer 2025 season!). Still spring 2026 produced a total of 1429kWh, bringing 2026's total generation so far to 1824kWh. That's just 64kWh lower than at this point in 2025.
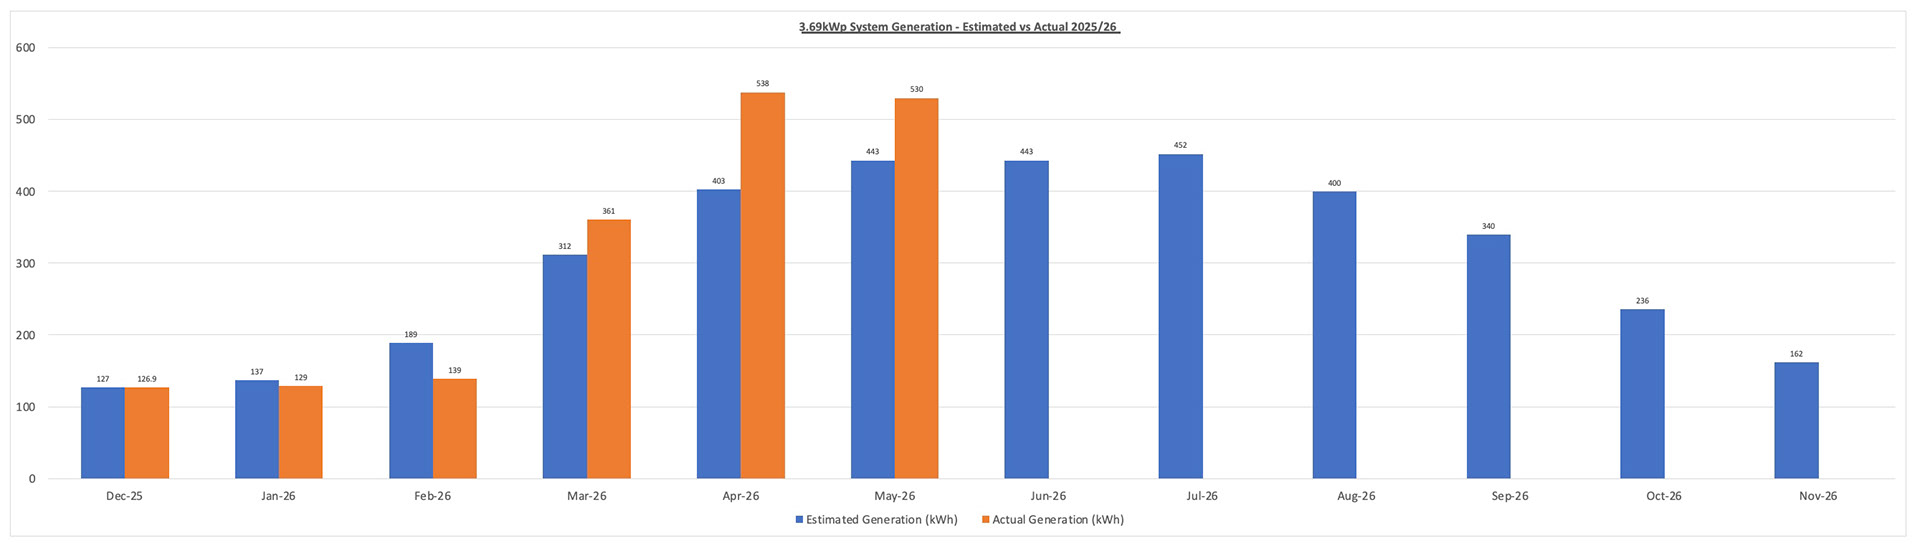
We went from being 58kWh under the estimated generation at the end of winter to being 213kWh ahead by the end of May. That's an overall swing of 271kWh.
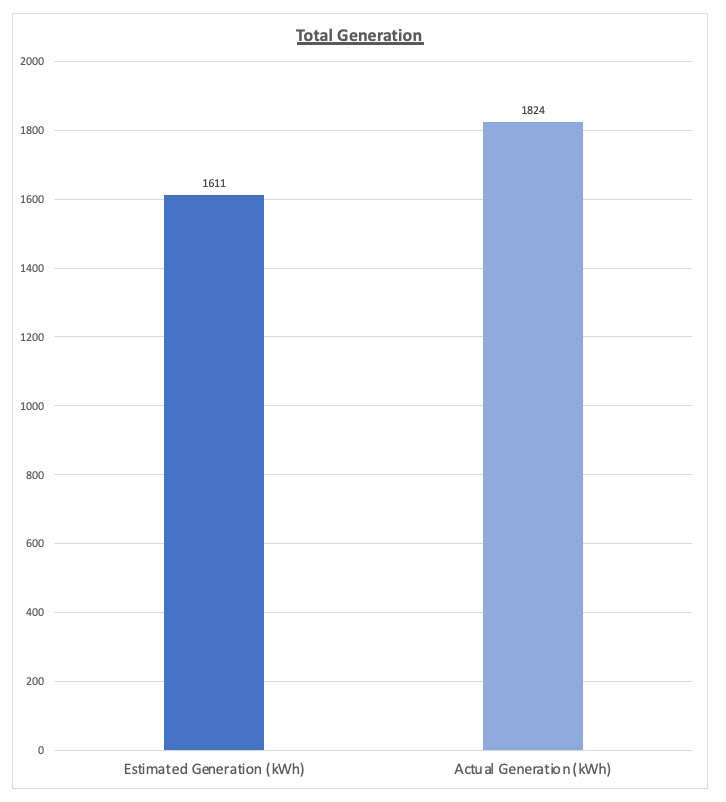
Estimated vs Actual Generation so far in 2026
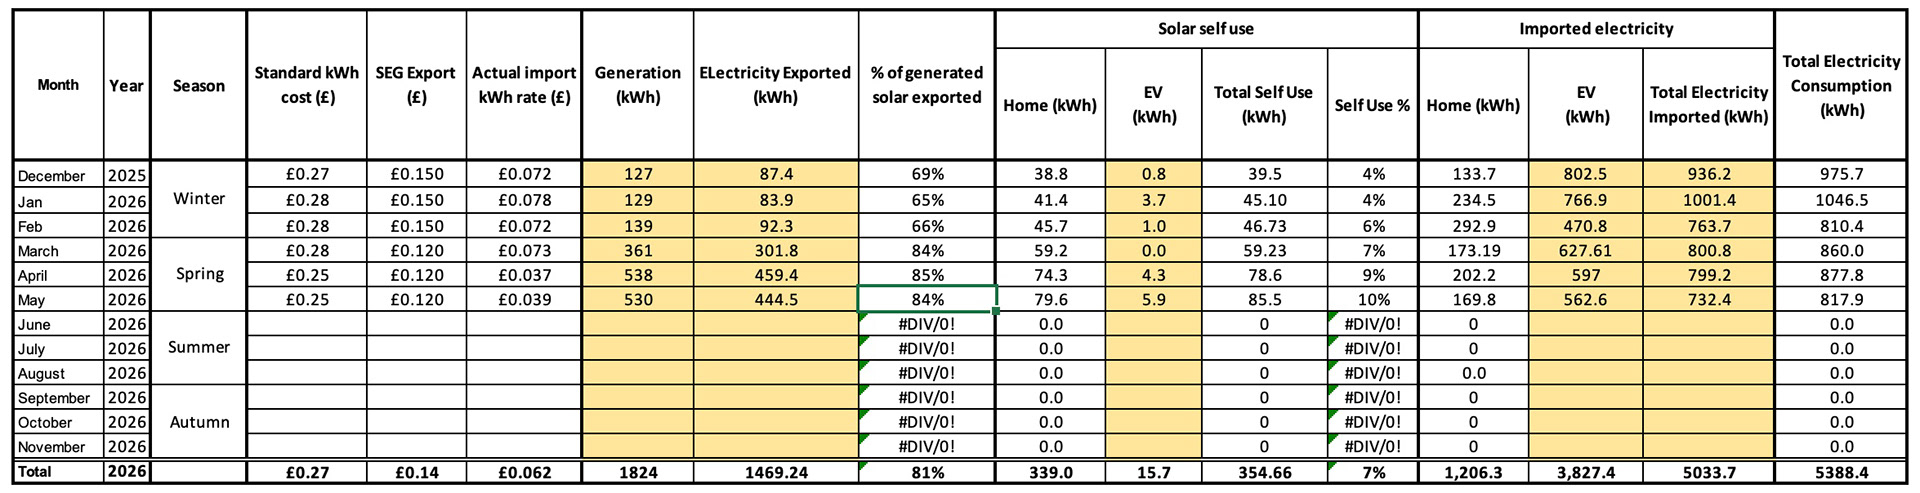
Solar data so far in 2026
Savings
Savings have started to pick up again in spring as we start to see higher SEG revenue.
Spring brought total savings of £317.18:
* SEG export payments saved £144.68.
* Saving Sessions/Campaign Rewards saved £0.56.
* Self consumption of 217kWh saved £57.44
* Unit rate kWh savings from importing electricity during the low rate saved £114.50.
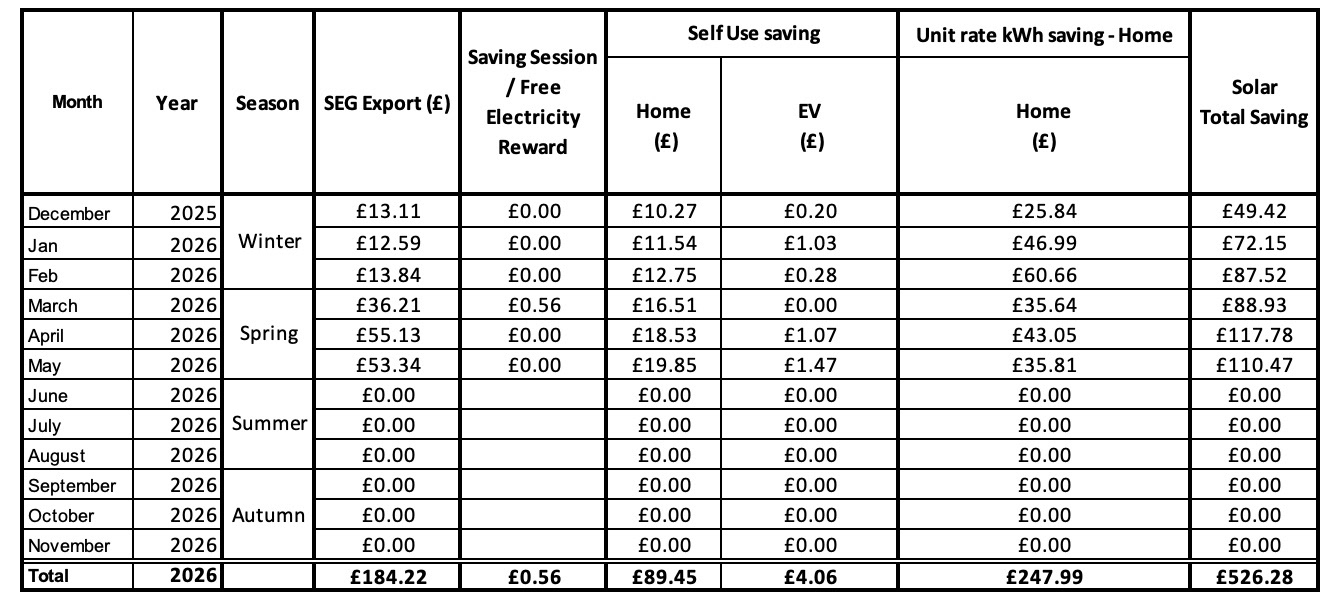
Savings so far in 2026
So far this year we've saved £526.28, which is £73.99 above savings at this point in 2025.
Summary
Key Statistics for spring
* 1429kWh generated.
* 1205.7kWh exported.
* 9% self sufficiency from solar.
* £317.18 saved.
* Highest generation - 25kWh on 22nd May.