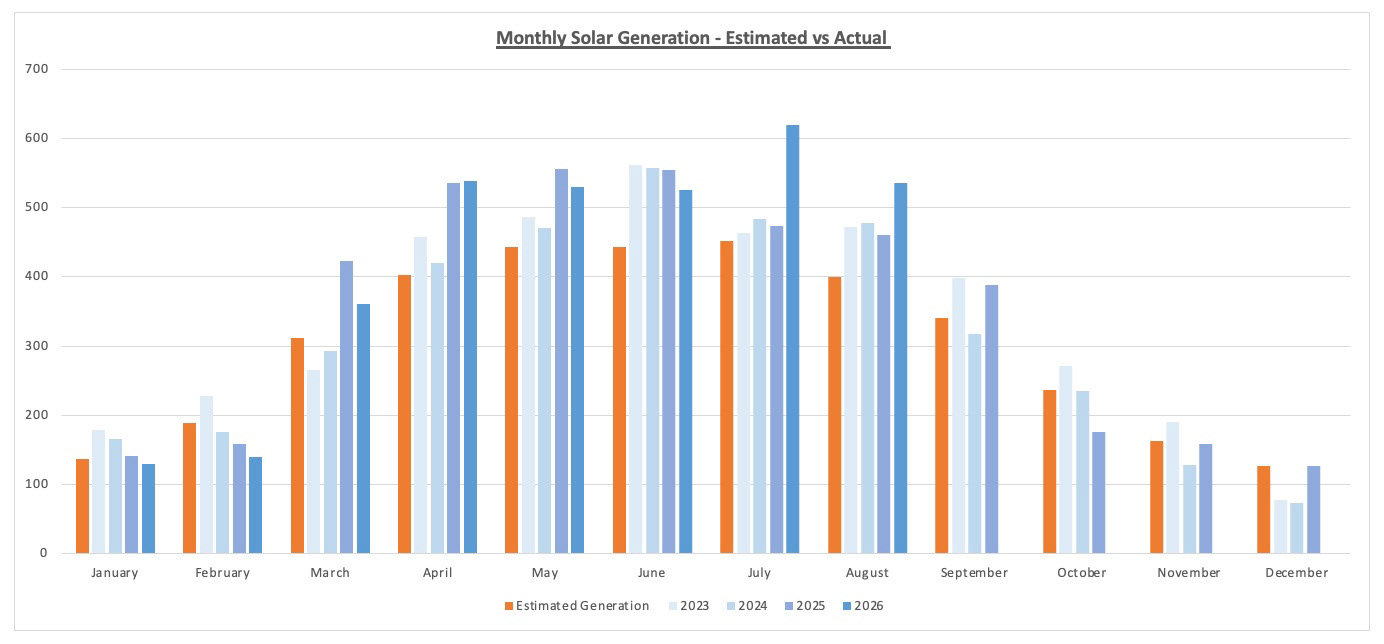
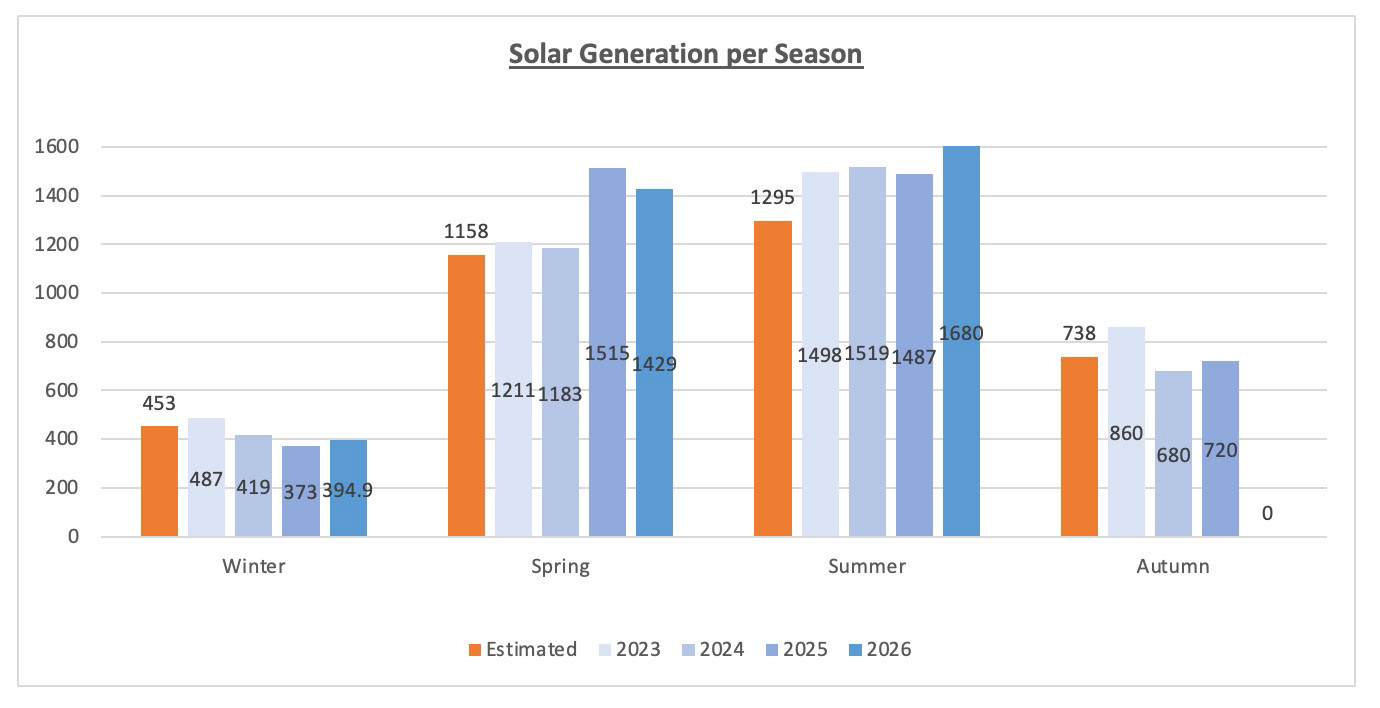
Summer is the season where solar generation peaks due longer days. Previous years have seen total generation in the summer months greater than our estimated generation. Hopefully summer 20026 would be the same.
Our Monthly Solar Performance
June 2026
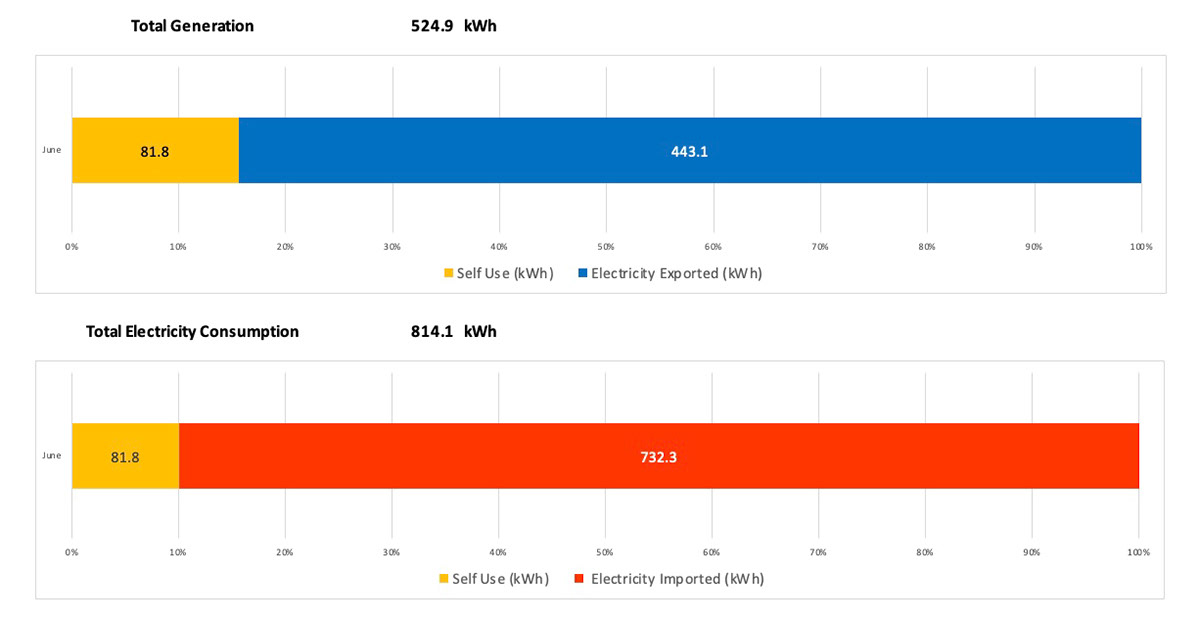
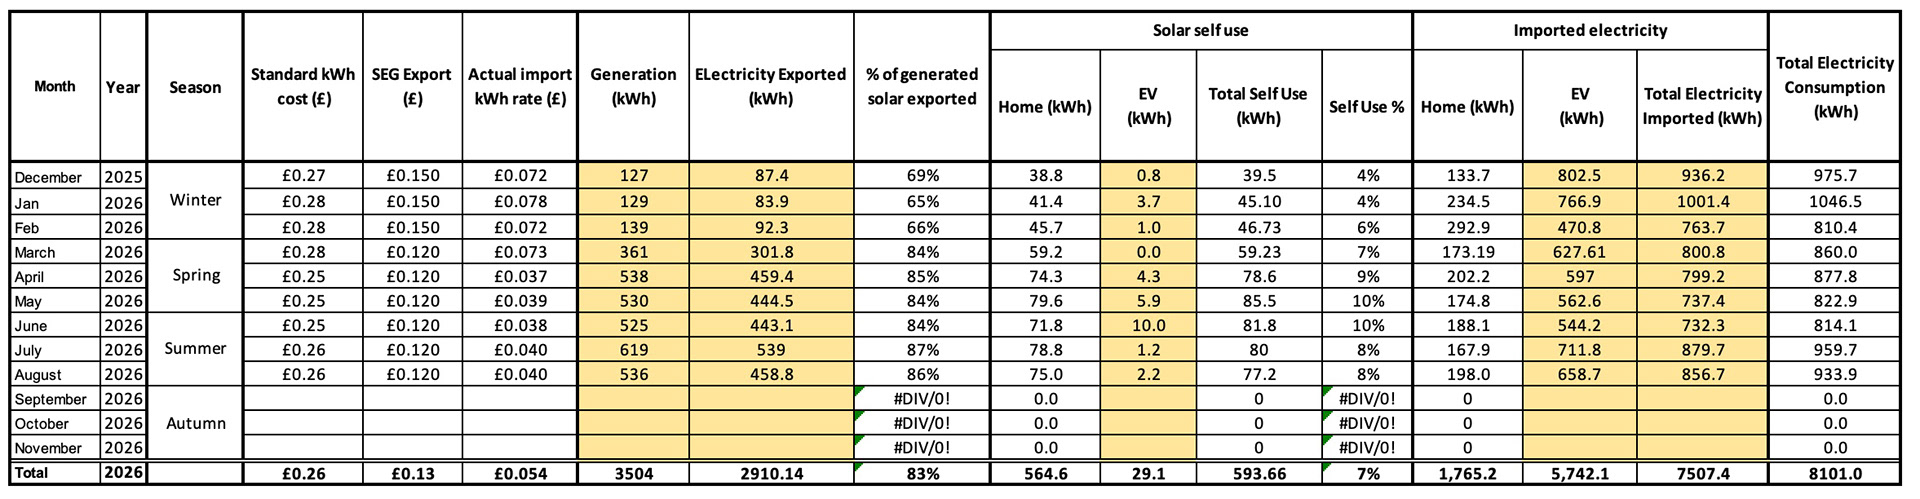
Generation this month was 524.9kWh, much higher than the estimated monthly solar generation of 443kWh. Whilst it seems high it was actual our lowest ever generation in June compared to previous years.
443.1kWh of solar electricity was exported this month, producing a SEG export payment of £53.17 via Outgoing Octopus at 12p/kWh.
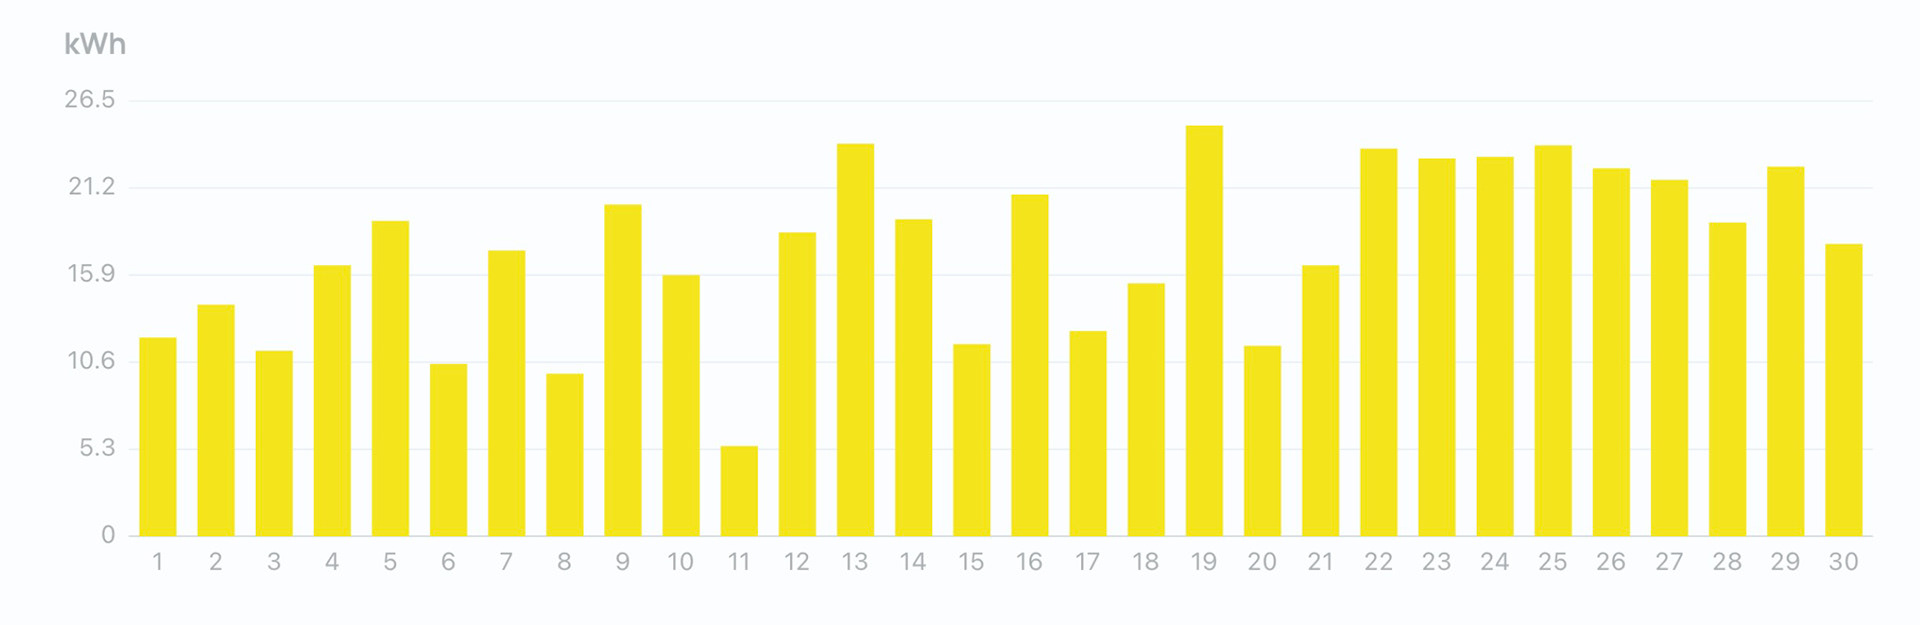
Generation per day over the month of June was ok. The month started slowly , but the end of the month was fantastic.
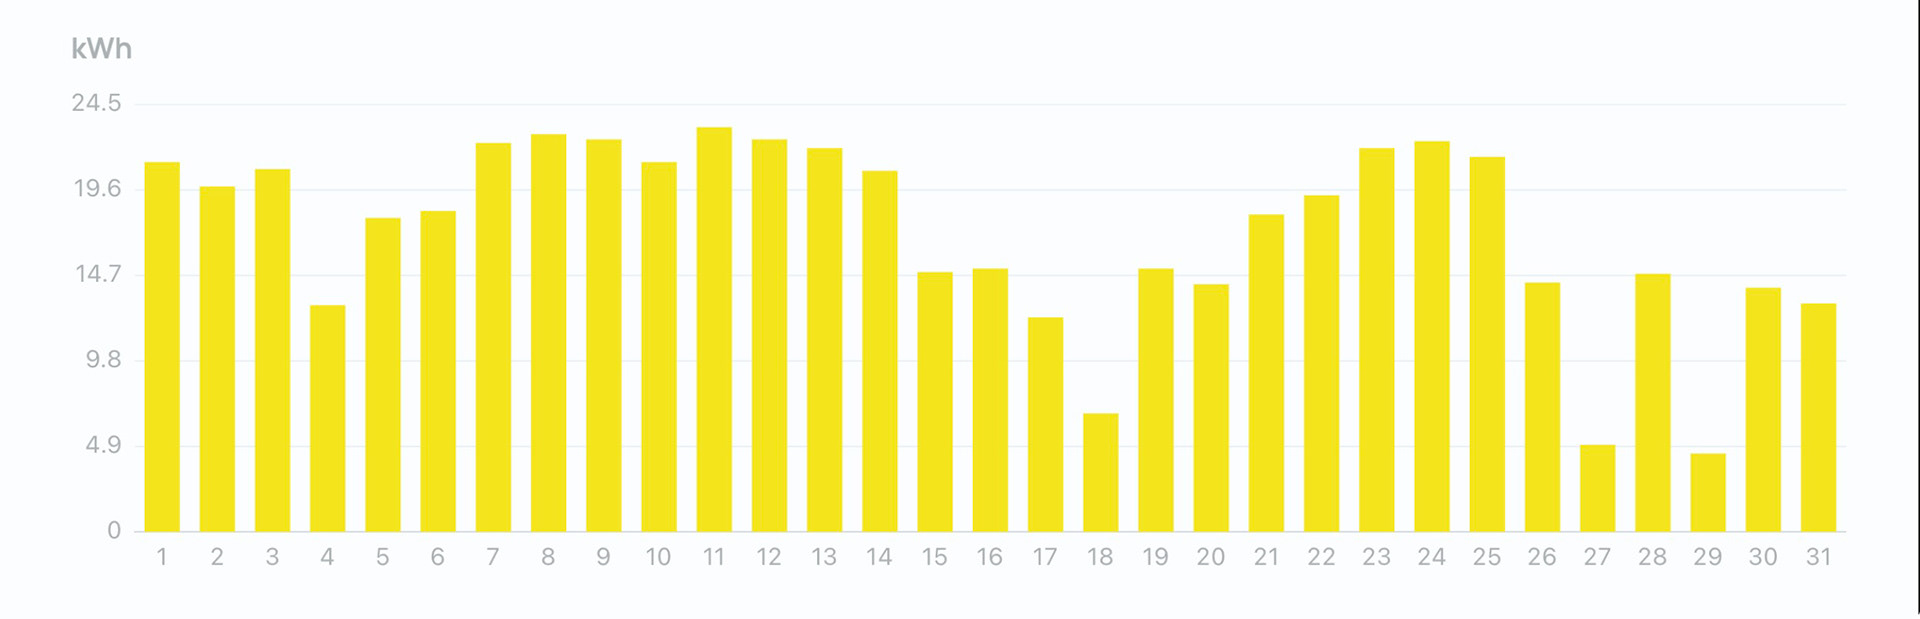
There were only 2 days below 10kWh and 10 days over 20kWh. Our highest daily generation was 19th June with 25kWh. The lowest was 5.5kWh on 11th June.
July 2026
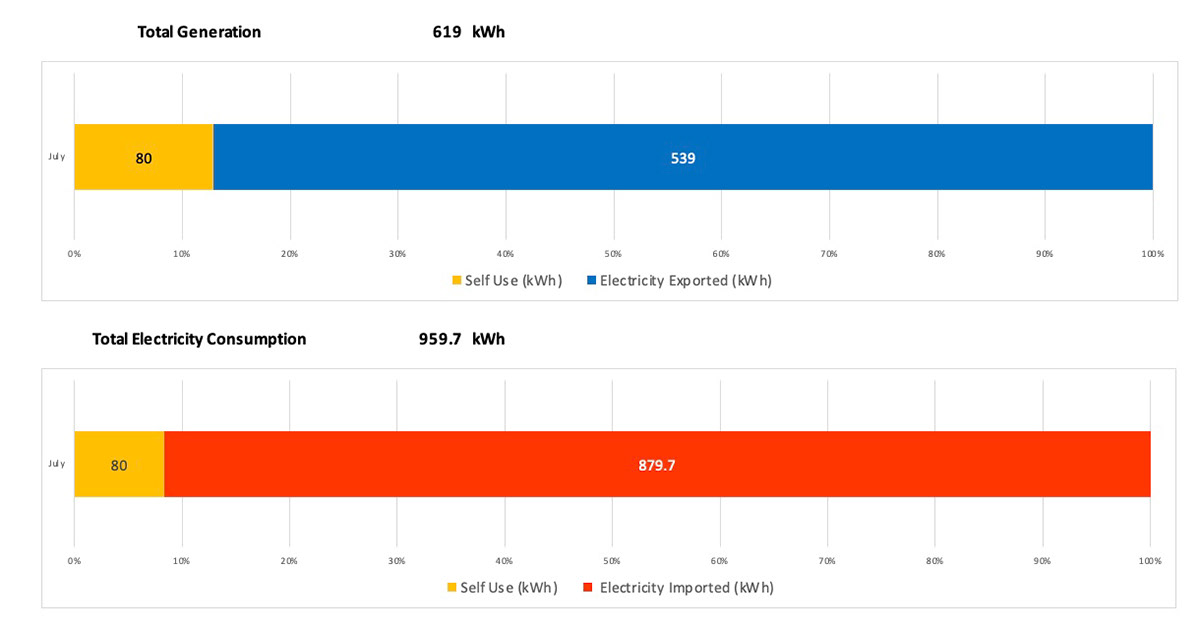
July saw a record 4th consecutive month of +500kWh, but also a record month that smashed the previous high record of 562kWh (June 2023) by 57kWh as July generated a whooping 619kWh! I never thought I'd ever see monthly generation break 600kWh barrier with our 3.6kWp solar array.
We exported 539kWh of the solar generation to the national grid (87% of the total generation).
Our self consumption this month was 8%, providing us with 80kWh of 'green' electricity for our home. This would have been if we charged our cars off the solar generation but it doesn't make sense to do that when we export at 12p/kWh and import at 3.5p/kWh.
Overall there were zero days were under 10kWh and 5 days under 15kWh. There was 18 days were over 20kWh. The highest being 25.7kWh on 2nd July. We nearly generated an average of 20kWh per day.
august 2026
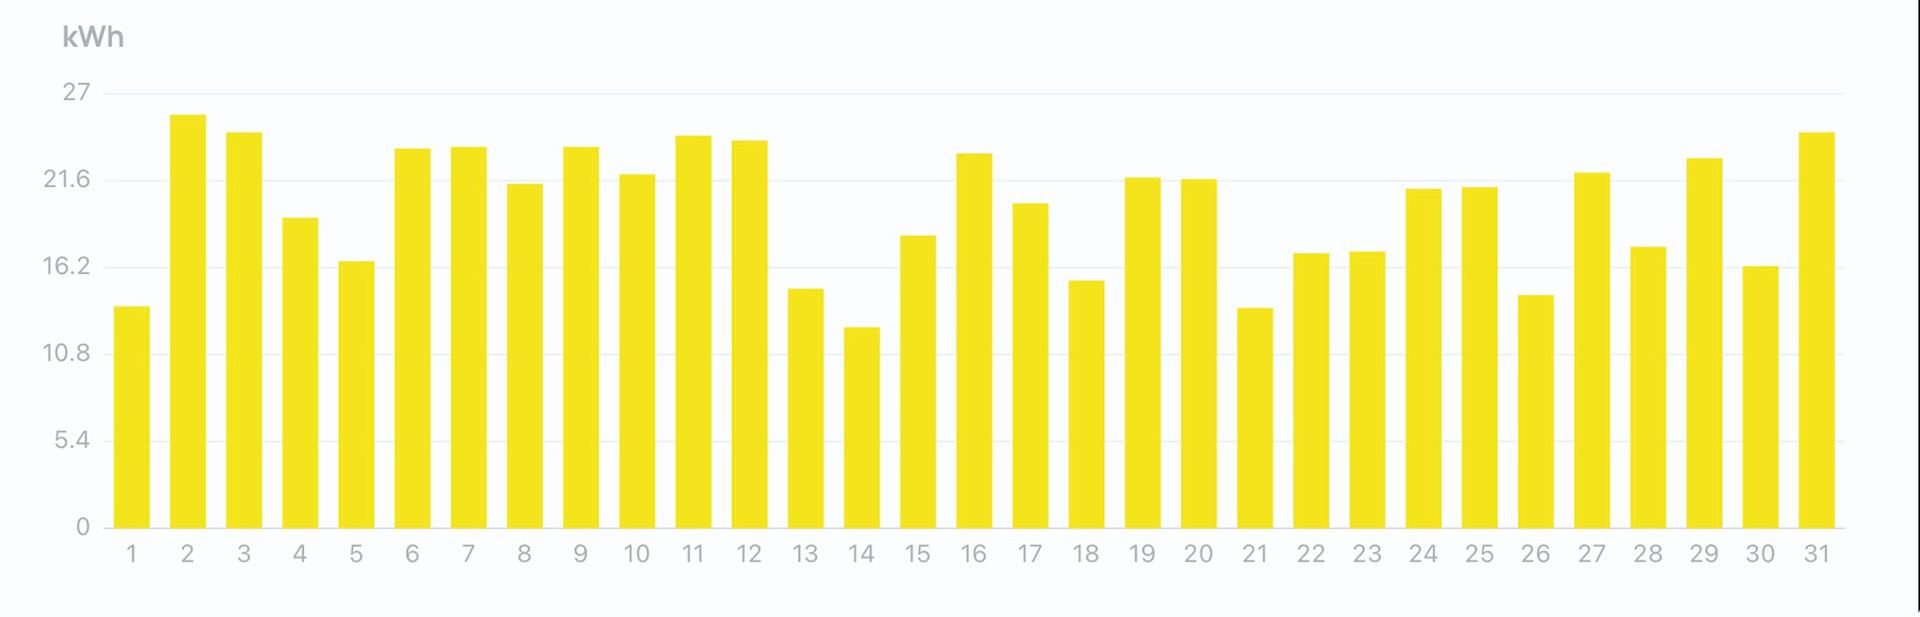
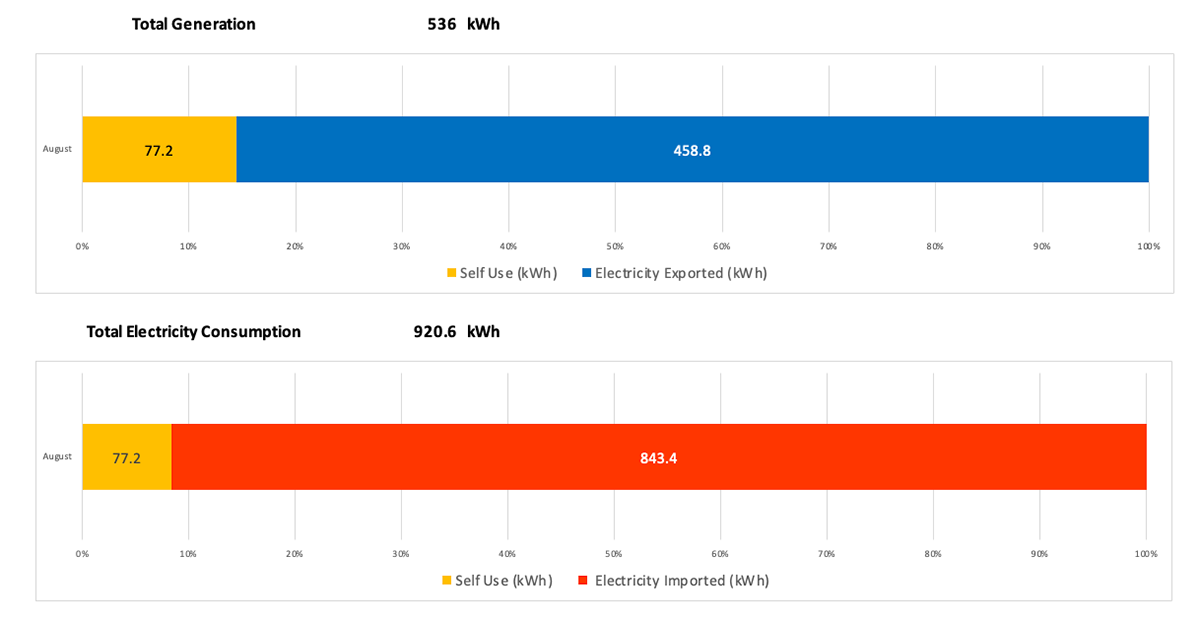
August saw a record 5th consecutive month of +500kWh as we managed to generate 536kWh. It was higher than the estimated generation for August of 400kWh. That was our highest ever generation in August and the first August we've passed 500kWh compared to previous years (460kWh in 2025, 478kWh in 2024 & 472kWh in 2023).
We exported 458.8kWh of the solar generation to the national grid (86% of the total generation).
The highest daily generation was 23.2kWh on 11th August. Our lowest was 4.5kWh on 29th August.
There were only 3 days under 10kWh generation and there were 13 days over 20kWh generation.
Our self use consumption (8%) as a percentage of total consumption was still very low compared to overall consumption due to charging our cars.
Generation Performance - edit red.
Generation performance throughout the summer months was stunning and carried on the +500kWh months from spring, bringing it to 5 consecutive months of +500kWh.
June was 19% above the expected generation with 525kWh.
July was 37% above the expected generation with 619kWh.
August generation 34% above the expected generation with 536kWh.
Overall our actual generation has performed better than the estimated expected generation of our 3.6kW system for six consecutive months for the second year running.
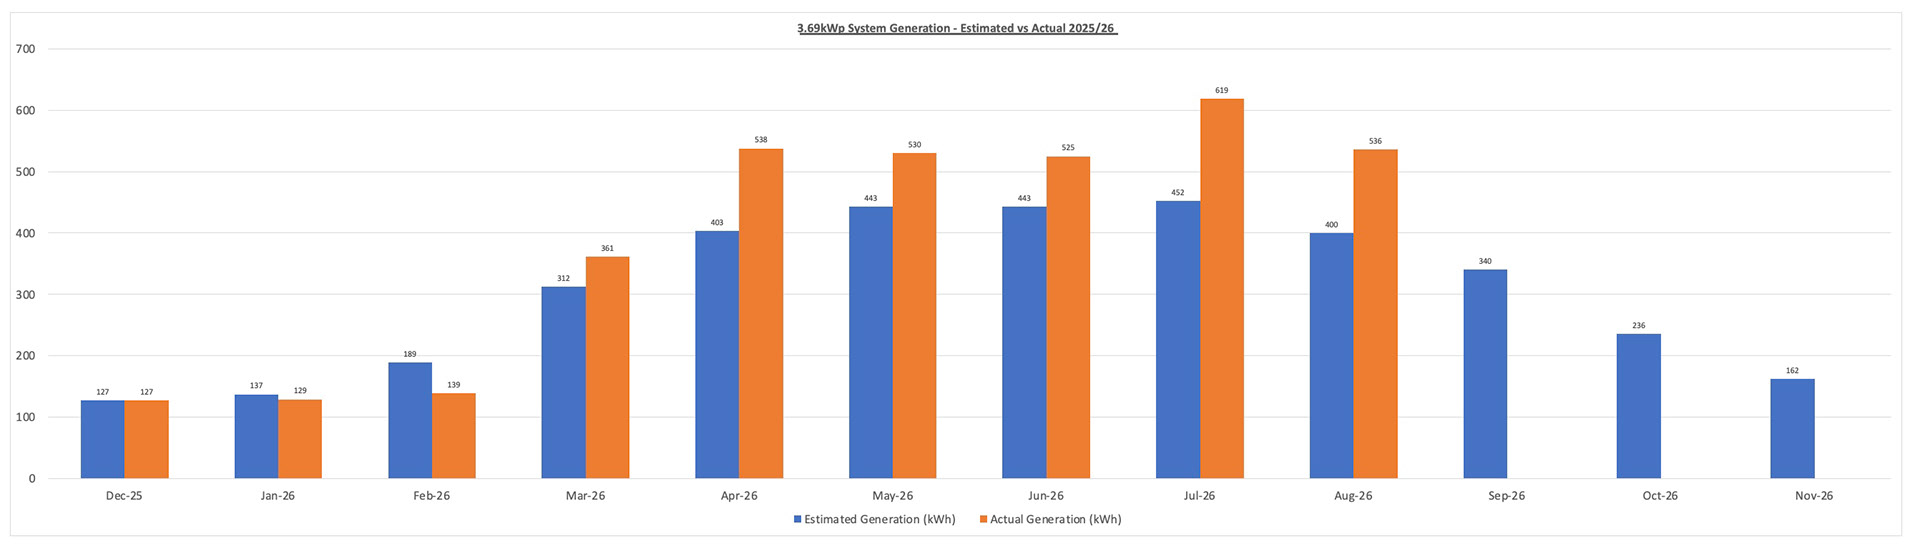
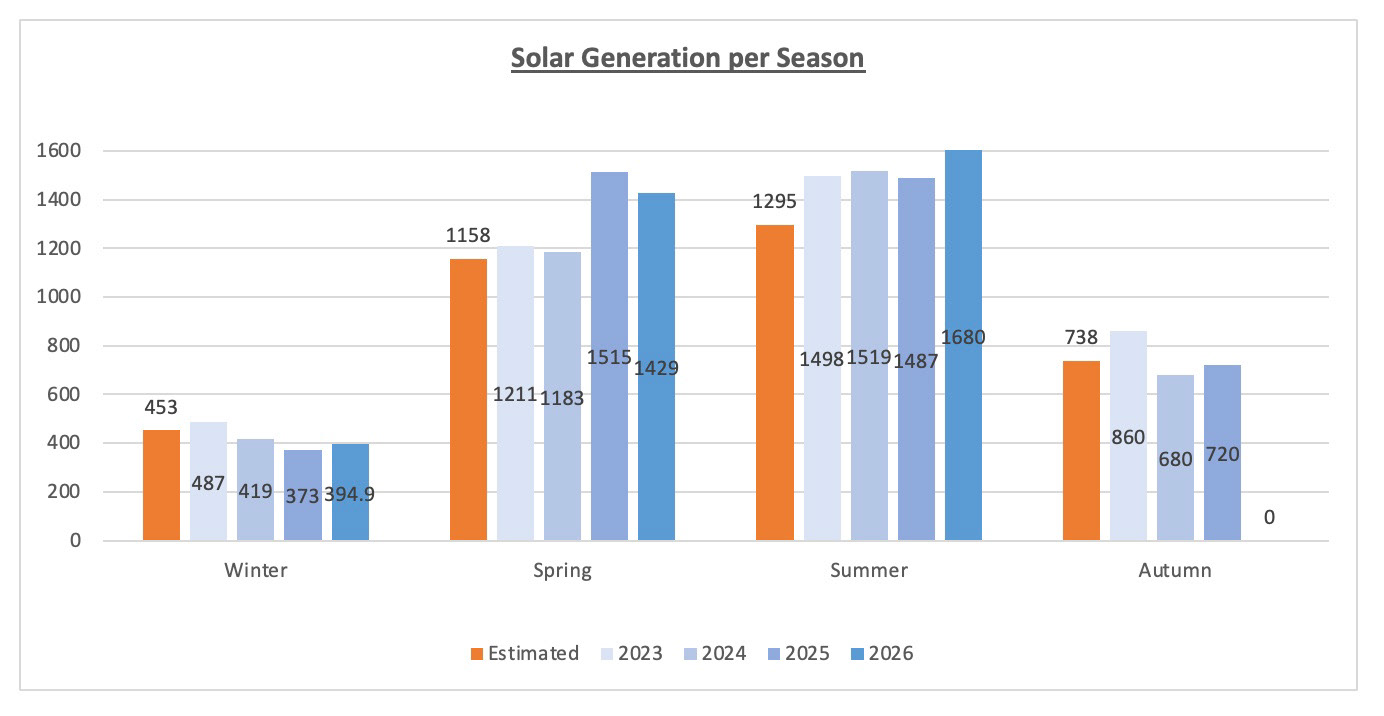
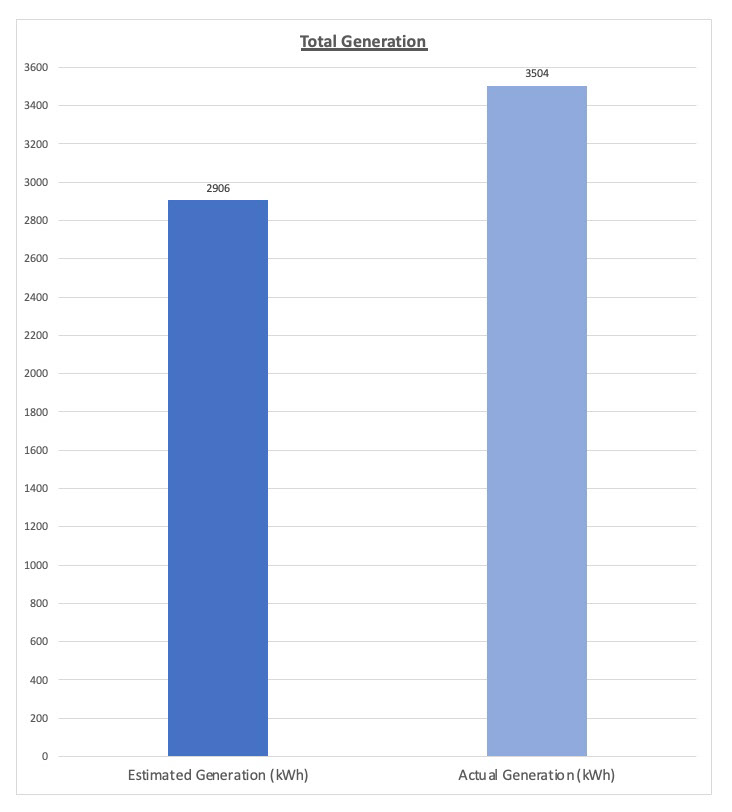
Summer generation of 1680kWh smashed previous years, beating the previous summer high of 1519kWh (2024) by 161kWh. For the year so far we've had our highest ever generation with 3504kWh. Thats just 140kWh off the annual estimated generation of 3644kWh, and there is still 3 months of autumn left too.
For the year so far our actual generation is still ahead of the estimated generation by 598kWh. That's 20% ahead of the estimated generation at this point of the year.
Savings
Of the total generation of 1680kWh we exported 1440.9kWh back to the national grid during the summer months. Self use consumption accounted for 239kWh.
Savings continued from spring into the summer month. Summer brought total savings of £361.11. Thats nearly £50 more than summer 2025 even though our export rate decreased from 15p/kWh to 12p/kWh.
A comparison of savings in summer 2025 and 2026 can seen in the table below.
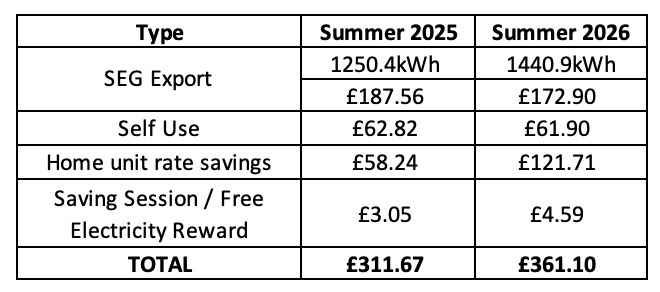
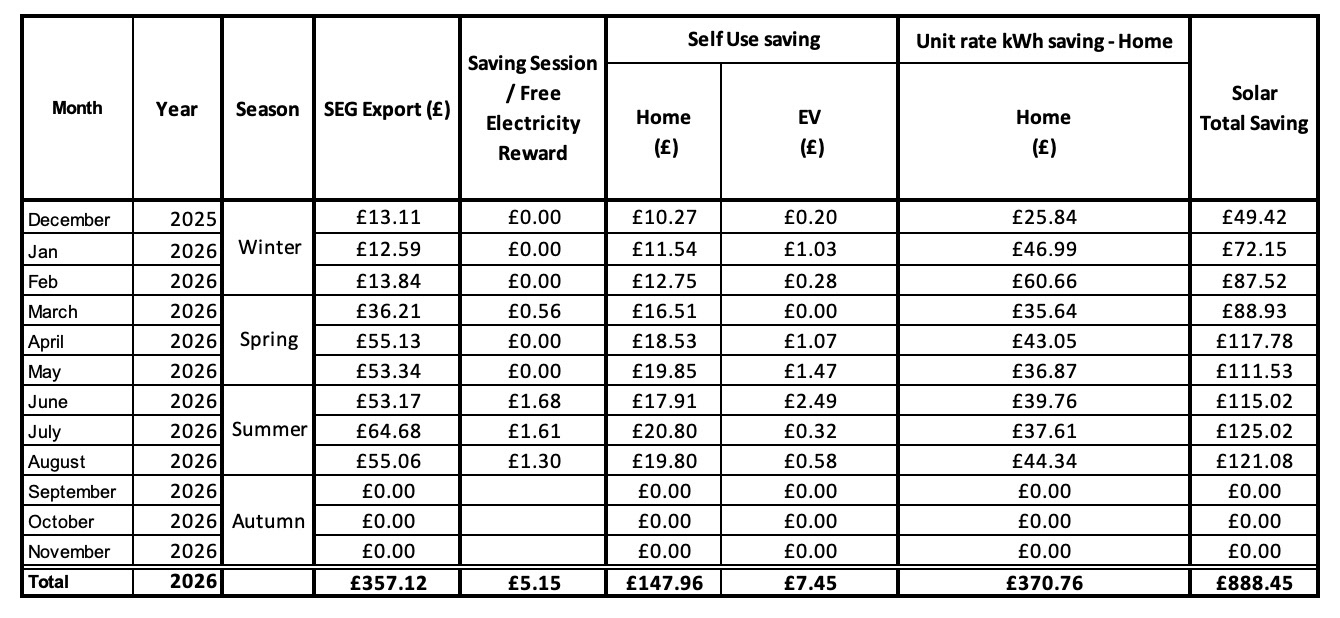
Overall I'm impressed with a total savings so far this year of £888.45 (up from £767.71 at this point in 2025). If I included unit cost savings from electricity consumed by the EV overall savings would be around £2,091.69 (up from £1705.51 at this point in 2025).
Summary
Key Statistics for summer:
* 1680kWh generated
* 1440.9kWh exported
* 239kWh self sufficiency from solar
* £361.10 saved
* Highest daily generation - 25.7kWh on 2nd July.
Summer 2025 compared to previous years
Whilst 2025 has been a fantastic year for solar generation (the spring season was just amazing), the summer season has in comparison, surprisingly, been on par with previous years.
In summer of 2025 there wasn't any record high generation months.
June - 4th (524.9kWh) - Worst ever June
July - 1st (619kWh) - Highest ever generation
August - 1st (536kWh) - Best ever August
Summer 2026 saw a total generation of 1680kWh. Thats our highest ever summer generation and 30% over the estimated summer generation of 1295kWh.
When we look at the estimated generation versus the actual generation figures we can see that April to August has performed above the expected generation consistently for 3 consecutive years.
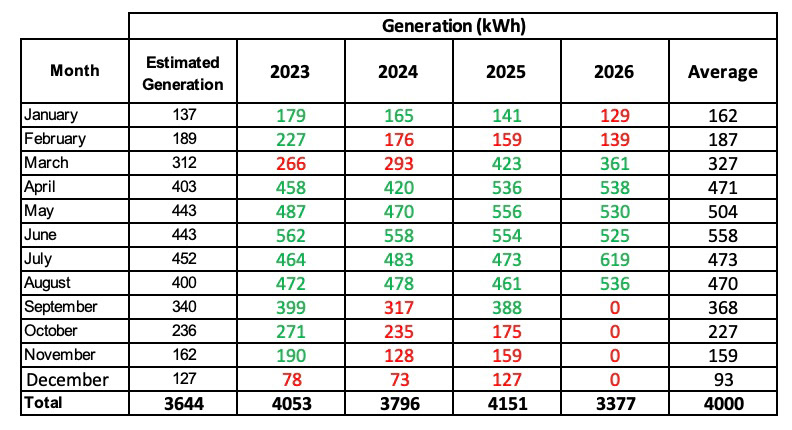
We are only 267kWh from meeting the estimated annual generation for our 3.6kWh solar solar. Looking at previous generation we should beat the annual estimation generation in September. It would be amazing if we can match the annual estimated generation in just 9 months.
Comparing our actual generation to previous years its clear to see how good July and August were compared to previous years.